EN-26
Obtaining Statistical Values from Input Data
To obtain statistical values, press A while in the Stat Editor and then
recall the statistical variable (σ
x, Σx
2
, etc.) you want. Supported statistical
variables and the keys you should press to recall them are shown below.
For single-variable statistical calculations, the variables marked with an
asterisk (*) are available.
Sum: Σ
x
2
*, Σx*, Σy
2
, Σy, Σxy, Σx
3
, Σx
2
y, Σx
4
11(STAT/DIST) 3(Sum) 1
to
8
Number of Items:
n*, Mean: o*, p, Population Standard Deviation: σx*,
σ
y, Sample Standard Deviation: sx*, sy
11(STAT/DIST) 4(Var) 1
to
7
Regression Coefficients: A, B, Correlation Coefficient:
r, Estimated
Values:
m, n
11(STAT/DIST) 5(Reg) 1
to
5
Regression Coefficients for Quadratic Regression: A, B, C, Estimated
Values:
m
1
, m
2
, n
11(STAT/DIST) 5(Reg) 1
to
6
• See the table at the beginning of this section of the manual for the regression
formulas.
•
m, m
1
, m
2
and n are not variables. They are commands of the type that take
an argument immediately before them. See “Calculating Estimated Values”
for more information.
Minimum Value: minX*, minY, Maximum Value: maxX*, maxY
11(STAT/DIST) 6(MinMax) 1
to
2
(When the single-variable statistical calculation is selected.)
11(STAT/DIST) 6(MinMax) 1
to 4
(When a paired-variable statistical calculation is selected.)
First Quartile: Q1, Median: med, Third Quartile: Q3
11(STAT/DIST) 6(MinMax) 3
to 5
(When the single-variable statistical calculation is selected.)
Note: While single-variable statistical calculation is selected, you can input
the functions and commands for performing normal distribution calculation
from the menu that appears when you perform the following key operation:
11 (STAT/DIST) 5 (Distr). See “Performing Normal Distribution
Calculations” for details.
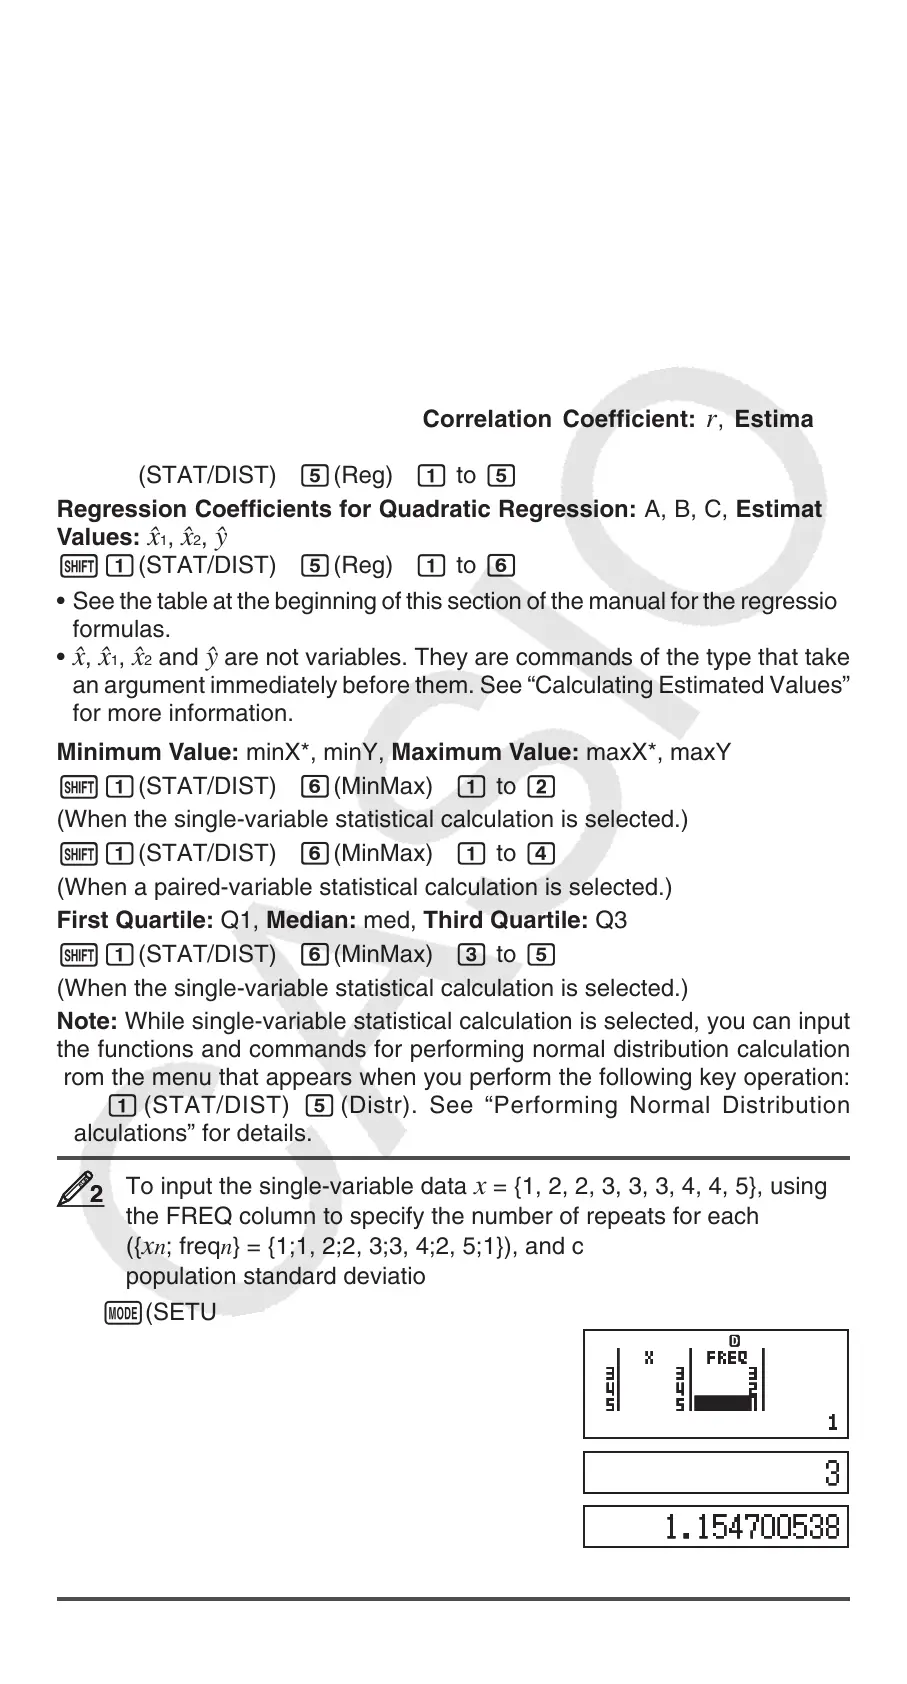
To input the single-variable data
x = {1, 2, 2, 3, 3, 3, 4, 4, 5}, using
the FREQ column to specify the number of repeats for each items
({x
n
; freq
n
} = {1;1, 2;2, 3;3, 4;2, 5;1}), and calculate the mean and
population standard deviation.
1N(SETUP)c4(STAT)1(ON)
N3(STAT)1(1-VAR)
1 = 2 = 3 = 4 = 5 =ce
1 = 2 = 3 = 2 =
A11(STAT/DIST)4(Var)2(o)=
A11(STAT/DIST)4(Var)3(σ
x)=
Results: Mean: 3 Population Standard Deviation: 1.154700538
22
STATSTAT