STATISTICS
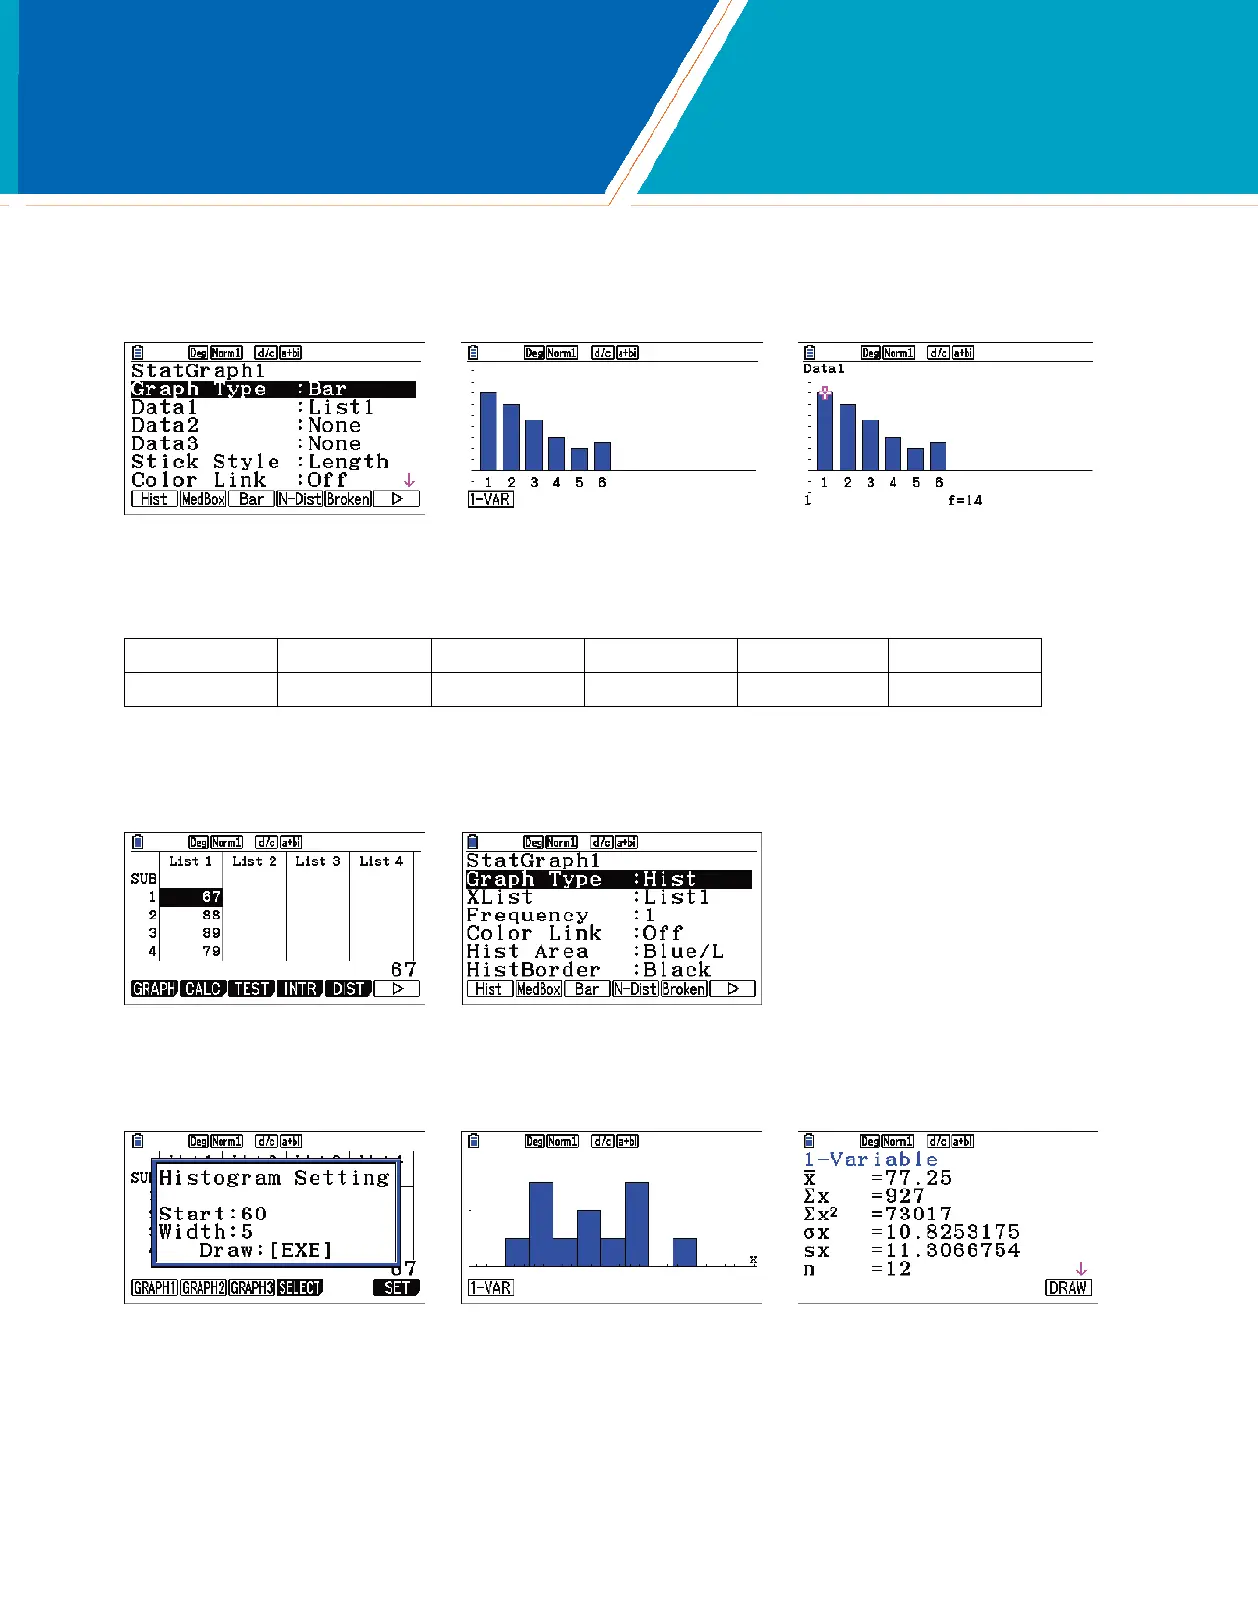
To change to a bar chart, press du(SET)Nu () e(Bar). Press dq(GRAPH1) to view the bar chart. To display the frequencies,
press Lq(Trace).
2. The number of games won (out of 162) by a certain baseball team for the years 2002 – 2013 are shown in the table. Construct a histogram and a
boxplot for these data.
67 88 89 79 66 85
97 83 75 71 61 66
Enter these data in the list editor. To set StatGraph1 to a histogram, press q(GRAPH) and u(SET). For Graph
Type, select q(Hist).
Press dq(GRAPH1). Select Start and Width values to determine the rectangles that will be plotted. Press q(1-VAR)
to see the statistical analysis of the data.
fx-CG50 Quick Start Guide 17

 Loading...


