EasyManuals Logo

Casio fx-CG50 Quick Start Guide

Casio fx-CG50
28 pages
To Next Page IconTo Next Page
To Previous Page IconTo Previous Page
Page #18 background imageLoading...
Page #18 background image
STATISTICS
Press u(DRAW) to return to the plot. To display the frequencies, press Lq(Trace).
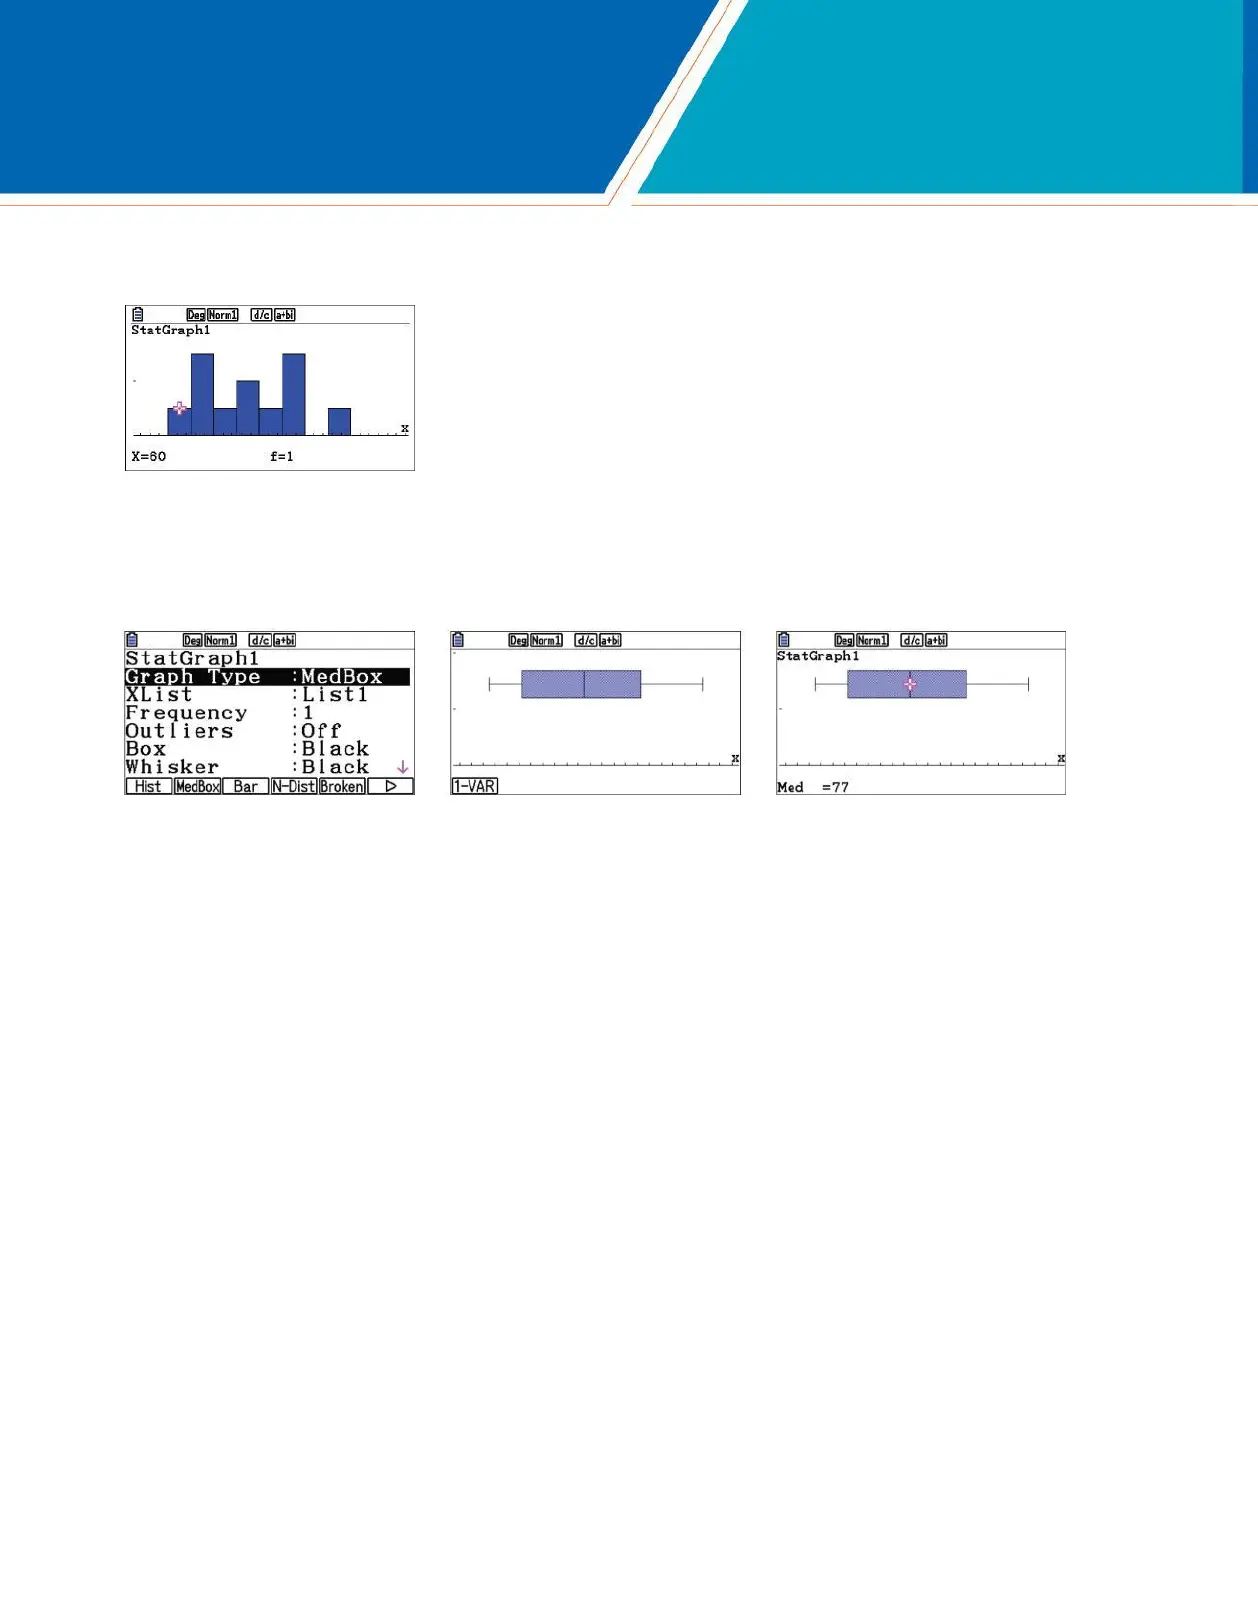
To change to a box-and-whisker plot (boxplot or median box plot), press du(SET). Scroll to Graph Type and press
w(MedBox). Press dq(GRAPH1). To display the minimum, maximum, and quartiles, press Lq(Trace). Use $ to display
the next value.
18 fx-CG50 Quick Start Guide

Other manuals for Casio fx-CG50

Questions and Answers:

Question and Answer IconNeed help?

Do you have a question about the Casio fx-CG50 and is the answer not in the manual?

Casio fx-CG50 Specifications

General IconGeneral
Display TypeColor LCD
ConnectivityUSB
GraphingYes
Dimensions188.5 x 89 x 18.6 mm
Weight230 g
CASNo
Storage16 MB Flash ROM
3D GraphingYes
SpreadsheetYes
Equation SolverYes
Statistical FunctionsYes
Financial FunctionsYes
Power Source4 x AAA batteries
Programming LanguagesBASIC
Memory16 MB

Related product manuals