12
Q
uick Start Guide
The initial screen is the List Editor Screen that allows input of statistical data and
performs numerous statistical calculations. To input a list of single-variable data,
highlight the first cell under List 1 and enter each number followed by
l.
∂
For this example, input this set of data:
• 1, 0.5, 1.2, 4, -1, 1, 3, 5, 6, 3.4
∑
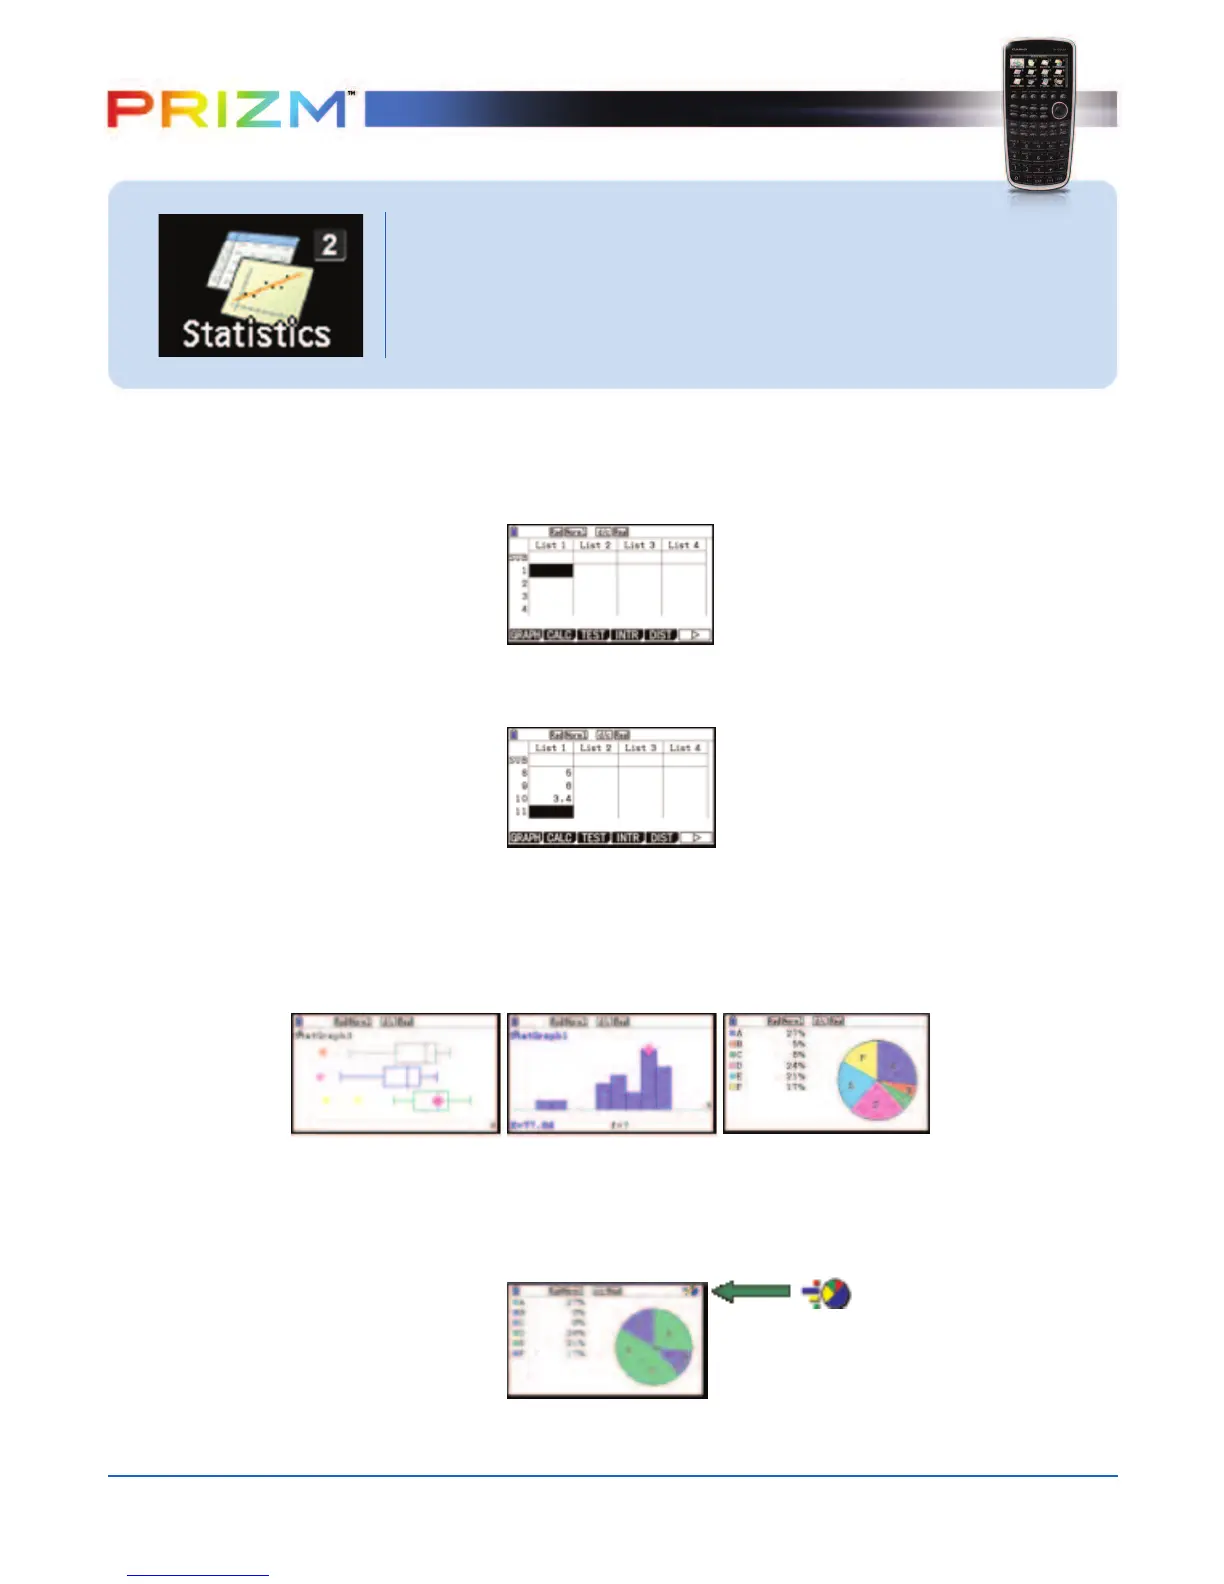
From this screen you can display various graphs depending on whether you have
single or paired-variable data (scatter plot, line, normal probability, histogram,
median box, mean box, normal distribution, broken line, and regression: linear,
quadratic, cubic, quartic, logarithmic, exponential, power, sinusoidal and logistic).
A few examples of statistics graphs are below:
Note: The colored icon in the status bar indicates that Color Link is on, meaning, you
can manually assign data a specific color. Here all values less than 20% appear in
blue and values greater than 20% appear in green.
STATISTICS
This section is an overview of the STAT icon; it will highlight just a few
of the features for single-variable data and paired-variable data.
To select this icon, you may highlight it and press
l or press 2.