Do you have a question about the Casio Prizm and is the answer not in the manual?
Accesses tab (soft key) menus and offers more on-screen choices when '>' appears.
Activates functions displayed in yellow above calculator buttons, like square root.
Draws, stores, and calculates information of functions.
Take images, plot points, perform regressions, and create tables from plotted data.
Use F6 for options, F2 (REG), then F6 (DRAW) for quadratic regression.
Select the Graph icon by highlighting and pressing EXE or pressing 5.
Input functions into Y1, press EXE to store, then F6 (DRAW) to graph.
Enter the function and press F6 (DRAW) to display the graph.
Use F5 (G-Solv) to find roots, maximums, minimums, intercepts, and integrals.
Press F1 (Root) to display roots, press EXE for coordinates, and use arrows for next root.
Use F3 (Maximum) to calculate the maximum value of the vertex.
Graph inequalities like y < x - 3 and set union/intersection mode.
Use F5 (G-Solv) options F1 (∫dx), F2 (ROOT), or F3 (INTSECT) to find integral values.
Select the RUN icon by highlighting and pressing EXE or pressing 1.
Enter fractions and mixed numbers using the dedicated input methods.
Use SHIFT F-D to toggle between fraction and mixed number formats.
Perform calculations involving complex numbers with 'i'.
Calculate summations using the Sigma (∑) function with specified bounds.
Select the TABLE icon by highlighting and pressing EXE or pressing 7.
Enter functions, press F3 (TYPE) for polar/parametric, and input into Y1.
Enter statistical data into List 1, followed by EXE.
| Display Type | Color LCD |
|---|---|
| Connectivity | USB |
| Graphing Capability | Yes |
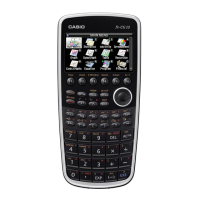
| Model | fx-CG10 (North America), fx-CG20 (Other regions) |
| Power Source | 4 AAA batteries |
| Memory | 16MB Flash ROM |
| Programming | BASIC-like language |
| Dimensions | 18.6 mm |
| Weight | 200 g |
| Resolution | 216 x 384 pixels |