6
Q
uick Start Guide
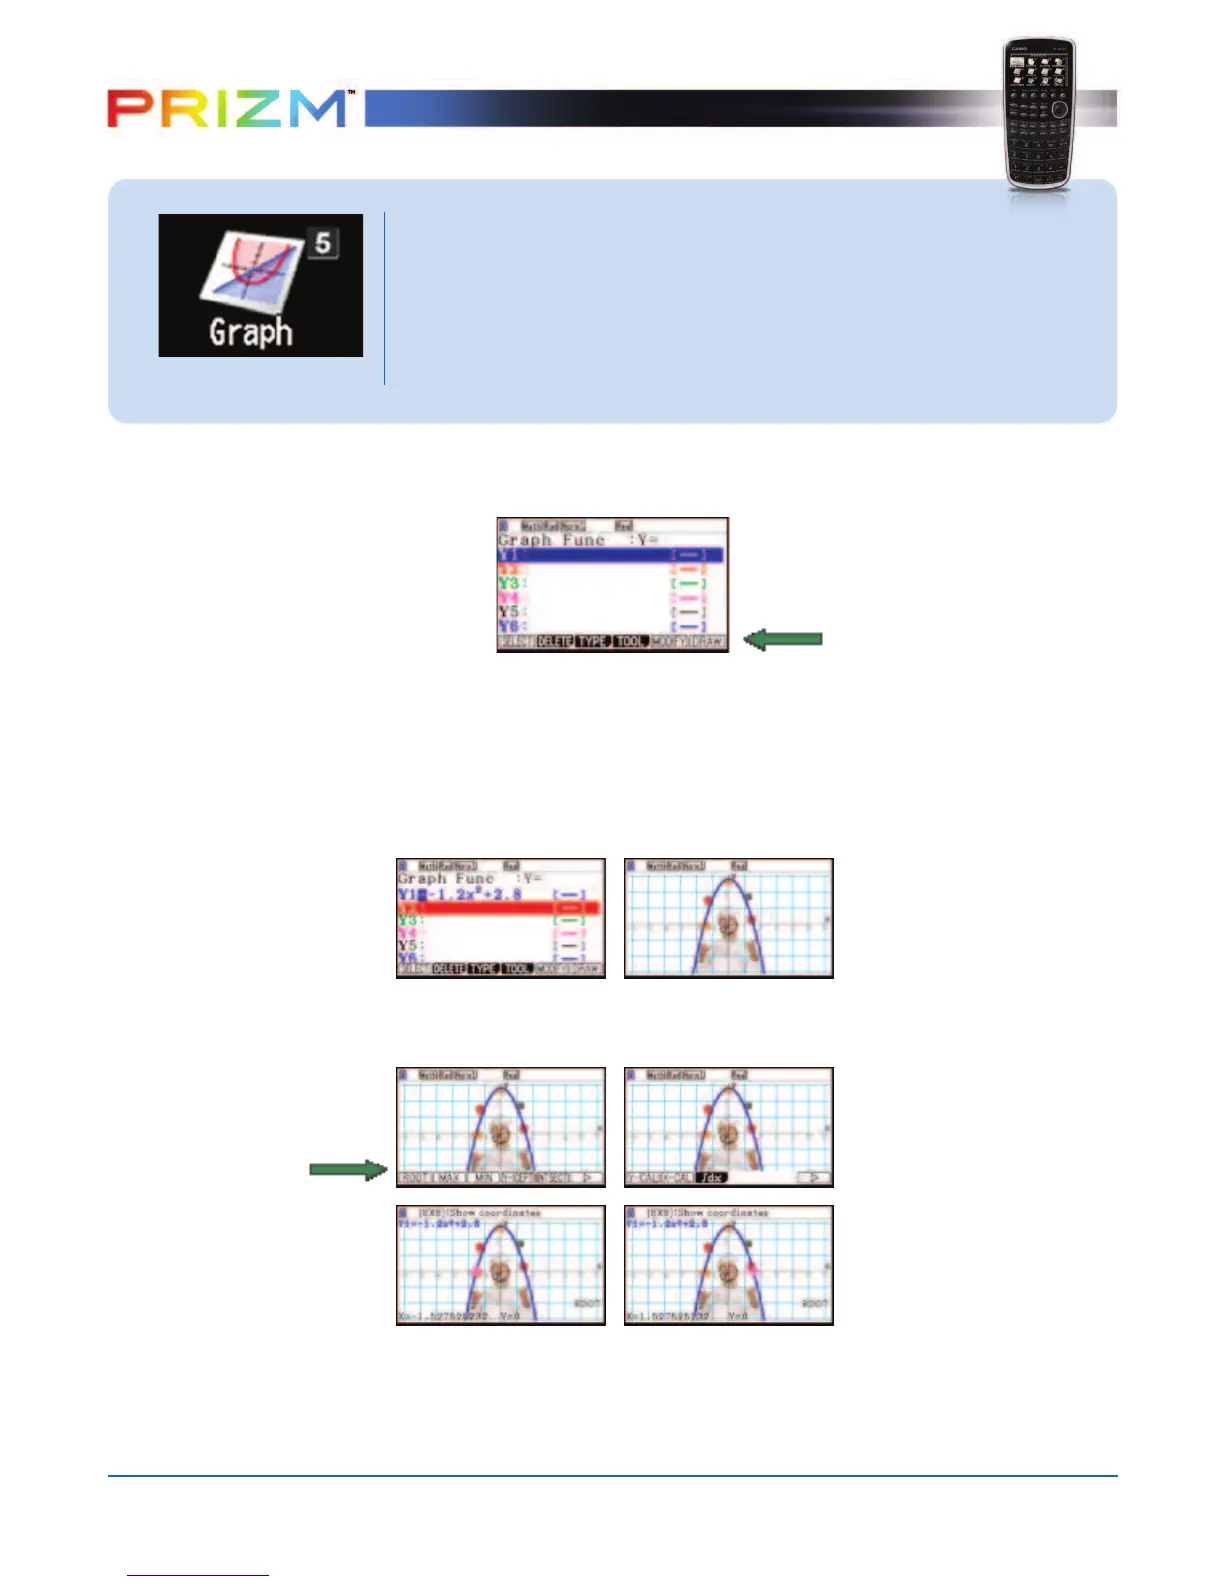
The initial screen allows immediate input of functions set equal to zero. You may begin
inputting data into
Y1: pressing l to store. To draw your function, select u(DRAW).
Note: Colors have been pre-determined for each function. To change the color of the
function, highlight the function and press L5(FORMAT).
∂
To draw the graph of the function y = -1.2x
2
+ 2.8, enter the following from the
GRAPH home screen:
• -1.2fs+2.8
To analyze features of this graph (roots, maximum and minimums, y-intercepts,
intersections, determine coordinates, and integrals) select y(G-Solv).
∑
q (Root):
Note: The left-most root within the window will always display first. Press lto display
the root’s coordinate on the graph as an ordered pair. Select $ to display the next
root to the right.
GRAPH
Various icons (Run, Table, Dynamic, Recursion & Conics) will allow
you to graph or analyze the graphs of given information. This section is
an overview of the GRAPH Icon and will highlight some basic features
of this mode. To select this icon, you may highlight it and
press l or press 5.
© Vladimir Mucibabic
- Fotolia.com