11
C. INSTALLATION PROCEDURE
MEASUREMENT RECOMMENDED LEVEL DETAILS
FREE CHLORINE
1.0 - 3.0 PPM
Recommended level for residential pools to keep chlorine at a proper
range for sanitization
pH
7.2 - 7.6
High pH reduces sanitizer efficiency. Low pH damages pool surfaces and
irritates skin and eyes
TOTAL ALKALINITY
(
TA
)
80 - 100 PPM Protects pH and prevents rapid pH "bounce"
CYANURIC ACID / STABILIZER
30 - 50 PPM
Protects chlorine from destruction by sunlight. Must be added manually
with salt chlorine systems
CALCIUM HARDNESS
200 - 400 PPM
Excess calcium can increase scaling problems. Low calcium (soft water)
can damage surfaces
PHOSPHATES ZERO Can deplete free available chlorine
SALT RESIDUAL
4,000 - 4,500 PPM
Ideal level for chlorine production. Powerclean Salt systems will operate
at 3,000 - 35,000 PPM
TABLE 3
-
WATER BALANCE
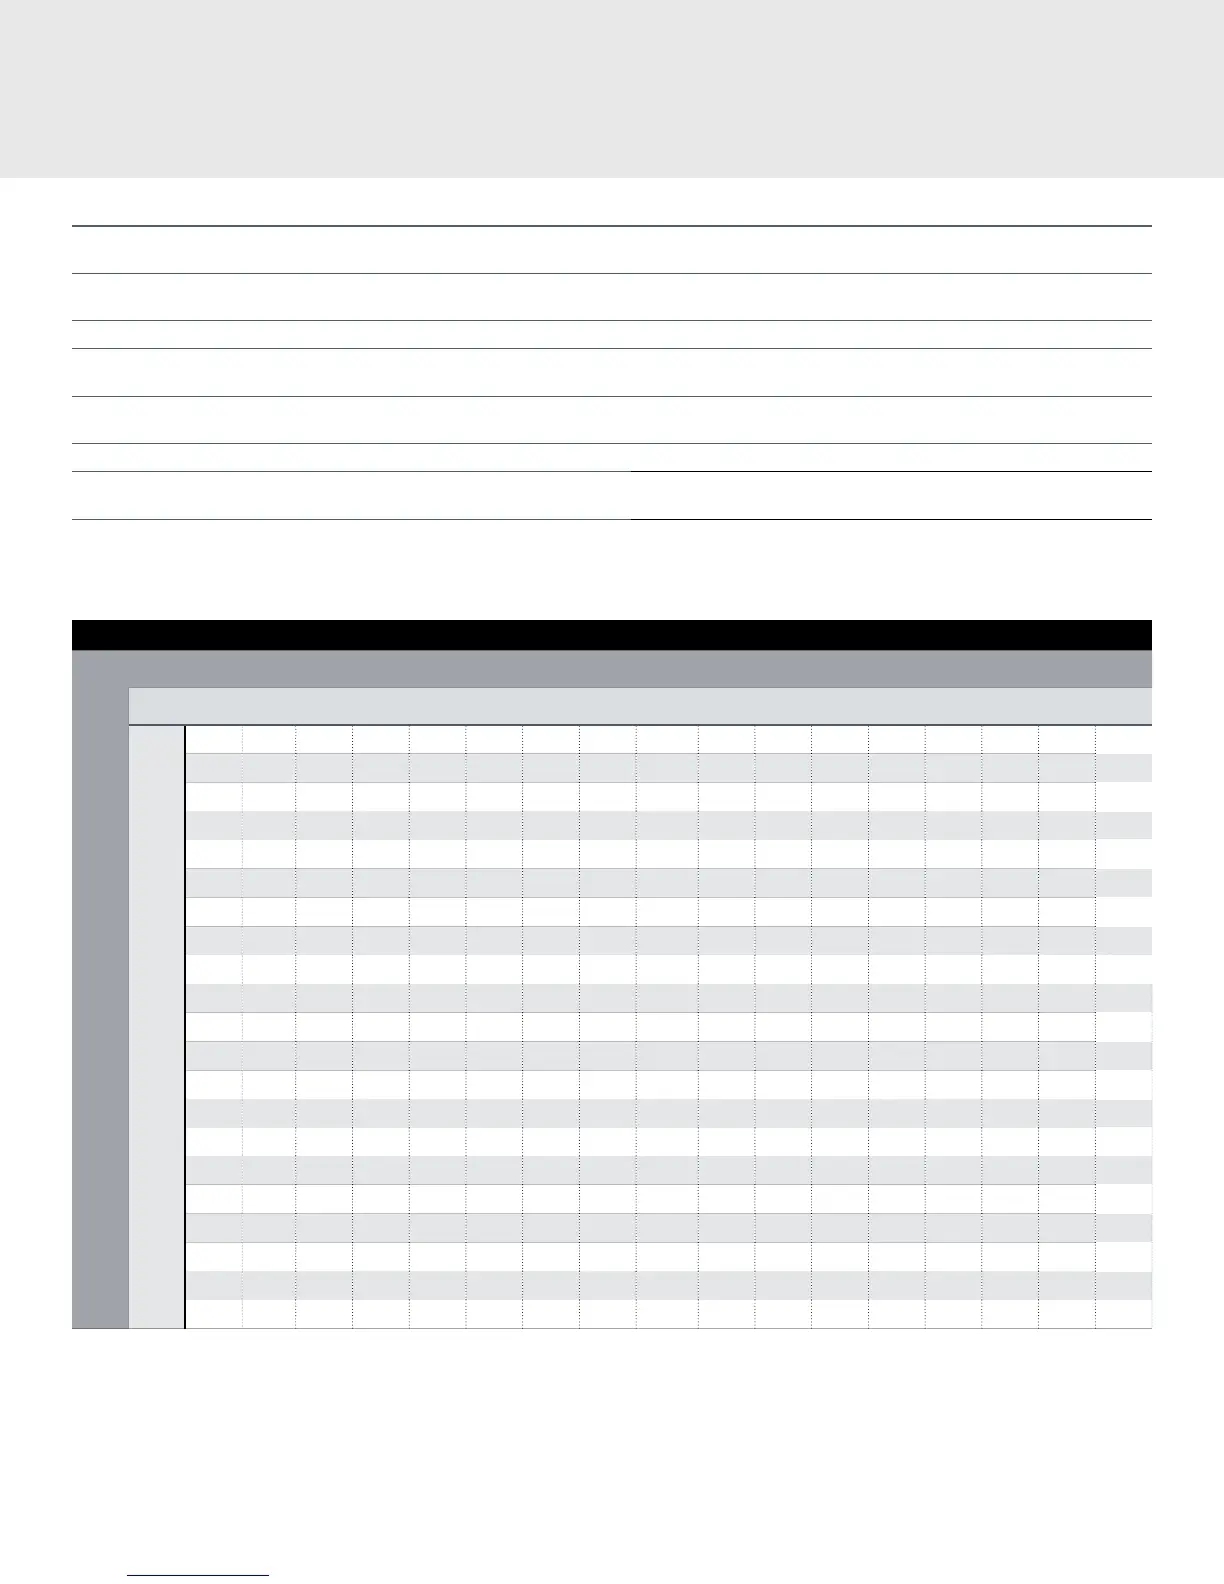
POUNDS OF SALT PER GALLON REQUIRED TO REACH 4,000 - 4,500 PPM
POOL SIZE (GALLONS)
8000 10000 12000 14000 16000 18000 20000 22000 24000 26000 28000 30000 32000 34000 36000 38000 40000
CURRENT POOL SALT CONCENTRATION (PPM)
0 266 334 400 466 533 600 637 733 800 867 933 1000 1067 1113 1200 1267 1335
200 253 315 380 443 507 570 633 697 760 823 887 950 1013 1076 1140 1203 1267
400 240 300 360 420 480 540 600 660 720 780 840 900 960 1020 1080 1140 1200
600 227 283 340 397 453 510 567 623 680 737 793 850 907 964 1020 1077 1135
800 213 266 320 374 427 480 533 587 640 693 747 800 853 907 960 1013 1067
1000 200 250 300 350 400 450 500 550 600 650 700 750 800 850 900 950 1000
1200 185 232 280 328 373 420 467 513 560 607 653 700 747 793 840 887 933
1400 171 215 260 305 347 390 433 477 520 563 607 650 693 737 780 823 867
1600 160 198 240 282 320 360 400 440 480 520 560 600 640 680 720 760 800
1800 147 182 220 258 293 330 367 403 440 477 513 550 587 523 660 697 733
2000 133 166 200 234 267 300 333 367 400 433 467 500 533 567 600 633 667
2200 120 150 180 210 240 270 300 330 360 390 420 450 480 510 540 570 600
2400 107 132 160 188 213 240 267 293 320 347 373 400 427 453 480 507 533
2600 93 116 140 164 187 210 233 257 280 303 327 350 373 397 420 443 466
2800 80 100 120 140 160 180 200 220 240 260 280 300 320 340 360 380 400
3000 67 84 100 116 133 150 167 183 200 217 233 250 267 283 300 317 333
3200 53 68 80 93 107 120 133 147 160 173 187 200 213 227 240 253 266
3400 40 50 60 70 80 90 100 110 120 130 140 150 160 170 180 190 200
3600 27 33 40 46 53 60 66 73 80 86 93 100 106 113 120 127 133
3800 13 16 20 23 26 30 33 36 40 43 47 50 53 57 60 63 67
4000 ok ok ok ok ok ok ok ok ok ok ok ok ok ok ok ok ok
TABLE 4
-
SALT ADDITION CHART