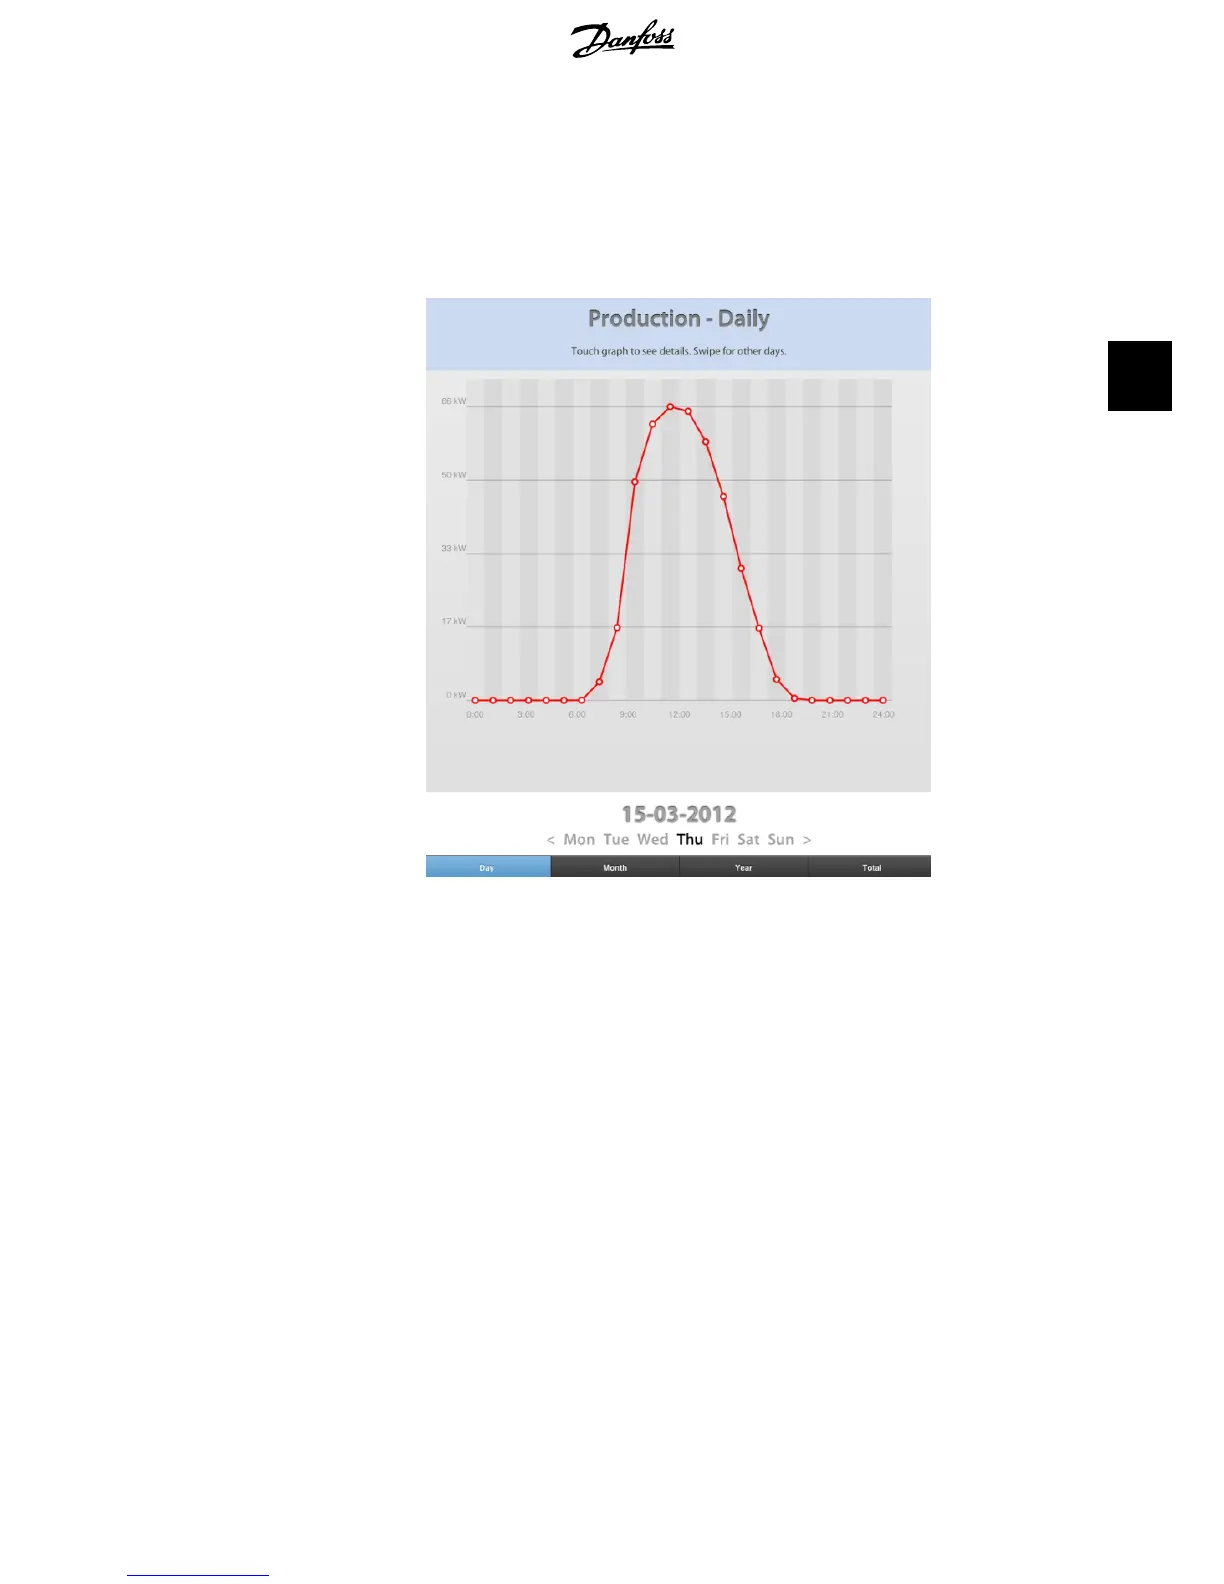
4.2. Production Graphs
The first graph displays the inverter's daily production (power versus hour of day). Swipe graph
to see production from different days. When using the Danfoss SolarApp on a tablet or in an
Internet browser, navigation arrows will appear.
Illustration 4.2: Daily Production
Monthly and yearly graphs are available by clicking on the buttons in the bottom area of the
page. By touching and holding the graph, a pop-up window with details about the data point
will appear.
The total menu button will display the total production, revenue and saved CO
2
in a list form for
the entire plant.
4. Application and Data
L00410618-03_02 13
4
 Loading...