5
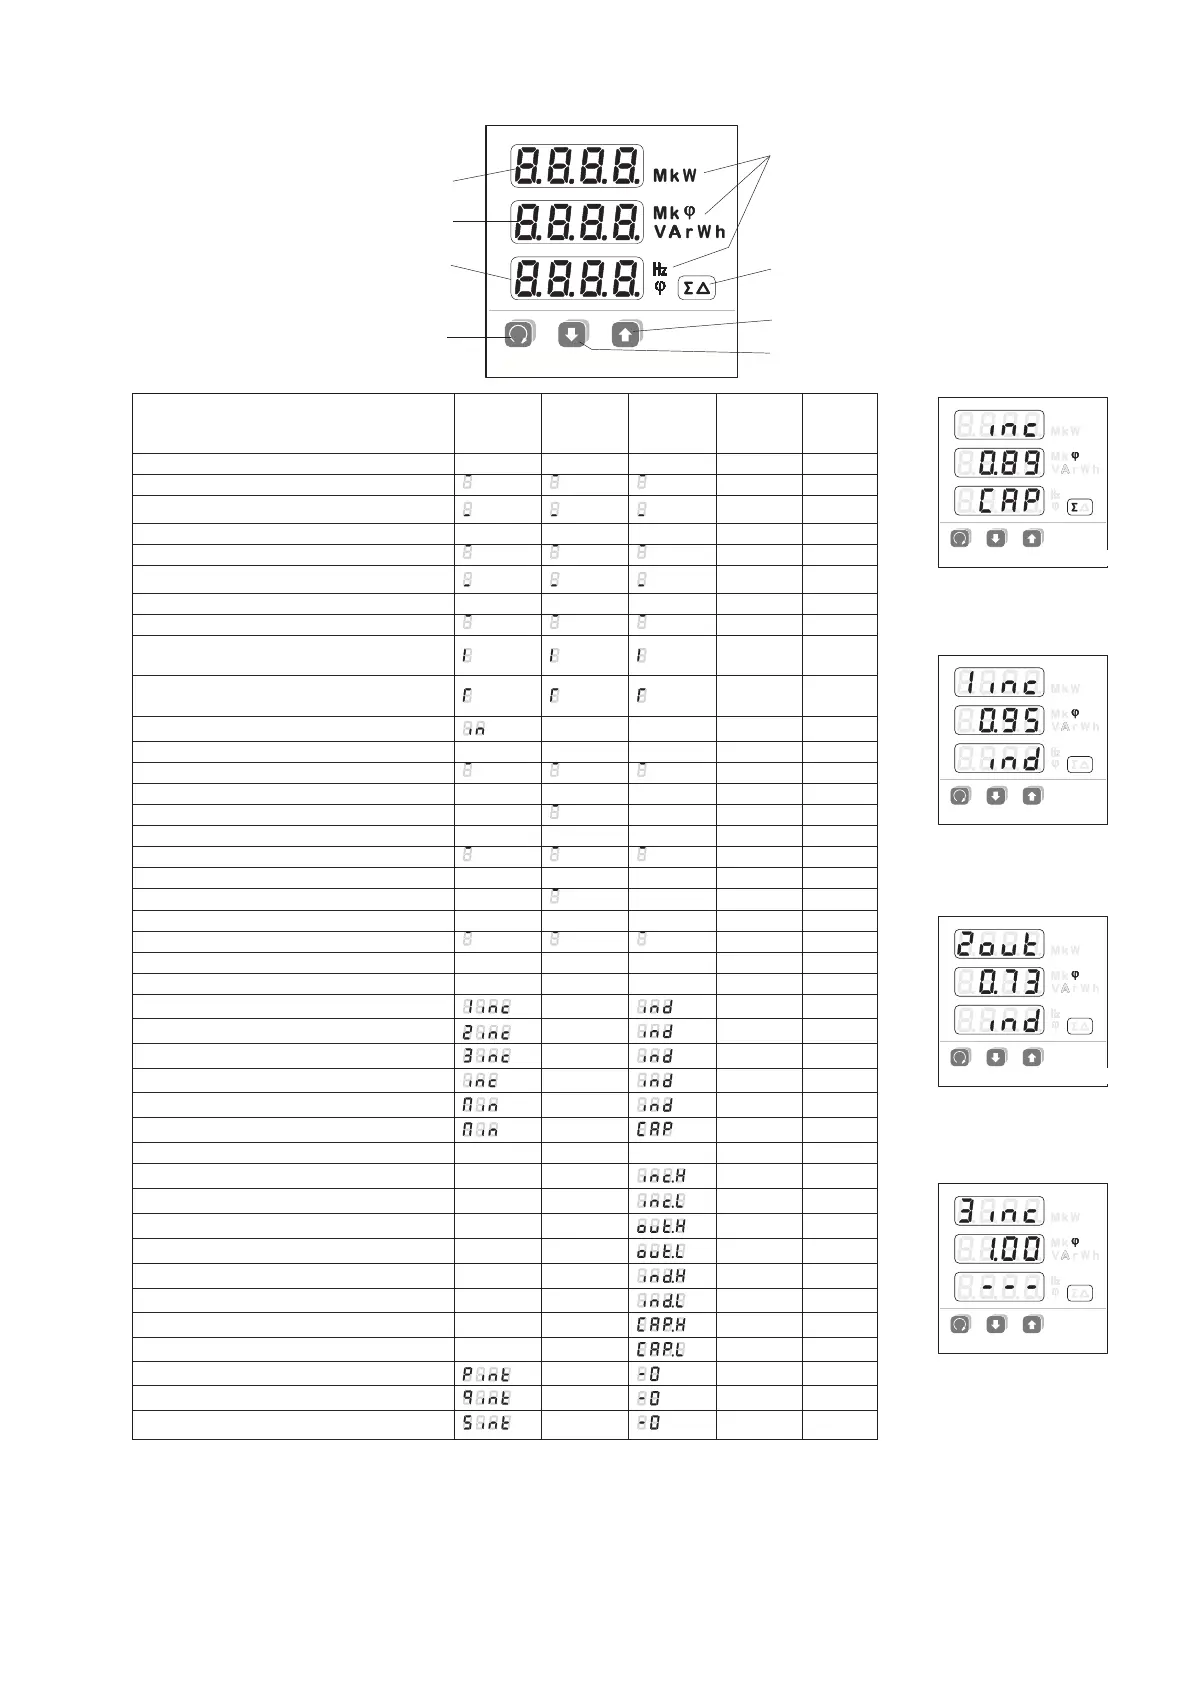
Display and operating
Available measurement data
Example
display
top
Example
display
centre
Example
display
bottom
Units
display
System
display
Phase voltages U1, U2, U3 230 231 229 V
Maximum value U1
max.
, U2
max.
, U3
max.
235 236 231 V
Minimum value U1
min.
, U2
min.
, U3
min.
227 226 225
V
Delta voltages U12, U23, U31 400 402 398 V ≤
Maximum values U12
max.
, U23
max.
, U31
max.
405 406 403 V ≤
Minimum values U12
min.
, U23
min.
, U31
min.
395 397 396
V ≤
Phase current I1, I2, I3 2.35 2.37 2.34 A
Maximum values I1
max.
, I2
max.
, I3
max.
2.39 2.40 2.38 A
Average values I1
avg
, I2
avg
, I3
avg
(bimetal -15 min.)
2.04 2.05 2.07
A
Max. average values I1
avgmax.
,
I2
avgmax.
, I3
avgmax.
(slave pointer-15 min.)
2.07 2.05 2.04
A
Neutral current IN 0.45 A
Active powers P1, P2, P3 56.1 56.2 56.5 kW
Maximum values P1
max.
, P2
max.
, P3
max.
60.5 60.4 60.3 kW
Active power system P 125 kW ≤
Maximum value P
max.
239 kW ≤
Reactive power Q1, Q2, Q3 1.24 1.23 1.22 VAr
Maximum values Q1
max.
, Q2
max.
, Q3
max.
1.51 1.52 1.54 VAr
Reactive power system Q 1.54 VAr ≤
Maximum value Q
max.
2.31 VAr ≤
Apparent power S1, S2, S3 2.56 2.58 2.60 VA
Maximum values S1
max.
, S2
max.
, S3
max.
3.43 3.44 3.67 VA
Apparent power system S 5.33 VA
Maximum value S
max.
6.23 VA ≤
Power factor PF1, cosϕ 0.87
ϕ
Power factor PF2, cosϕ 0.88
ϕ
Power factor PF3, cosϕ 0.89
ϕ
Power factor system PF, cosϕ 0.88
ϕ
≤
Minimum value power factor inductive 0.76
ϕ
≤
Minimum value power factor capacitive 0.84
ϕ
≤
Frequency, F 49.99 Hz
Active energy incoming EP high tariff 4589 2356 kWh ≤
Active energy incoming EP low tariff *) 1234 5678 kWh ≤
Active energy outgoing EP high tariff 4589 2356 kWh ≤
Active energy outgoing EP low tariff *) 1234 5678 kWh ≤
Reactive energy inductive EQ high tariff 9876 5432 kVarh ≤
Reactive energy inductive EQ low tariff *) 1234 9876 kVarh ≤
Reactive energy capacitive EQ high tariff 9876 5432 kVarh ≤
Reactive energy capacitive EQ low tariff *) 1234 9876 kVarh ≤
5 active power intervals Pint0, Pint1, … 234 kW ≤
5 reactive power intervals Qint0, Qint1, … 123 VAr ≤
5 apparent power intervals Sint0, Sint1, … 10.1 VA ≤
*) Tariff switching via digital input only (optional extension module required)
Power factor
cosϕ 4 quadrant
operation
System
Phase 1
Phase 2
Phase 3
P
Units display
System display
Up key
Down key
Key for
programming
and display
7-segment
display
top
centre
bottom
Display and operating are
identical for the ES210
and ES220
Determination of measured quantities: The calculation of the measurements is made in accordance with DIN 40 110, with the exception of the reactive
power. This is calculated by the ES210/ES220 as a signed value.
Transducers and displays can possibly display different values for the reactive power in the same power system.
The reason is the different calculation methods.
 Loading...