62
Gentier Real-Time PCR System
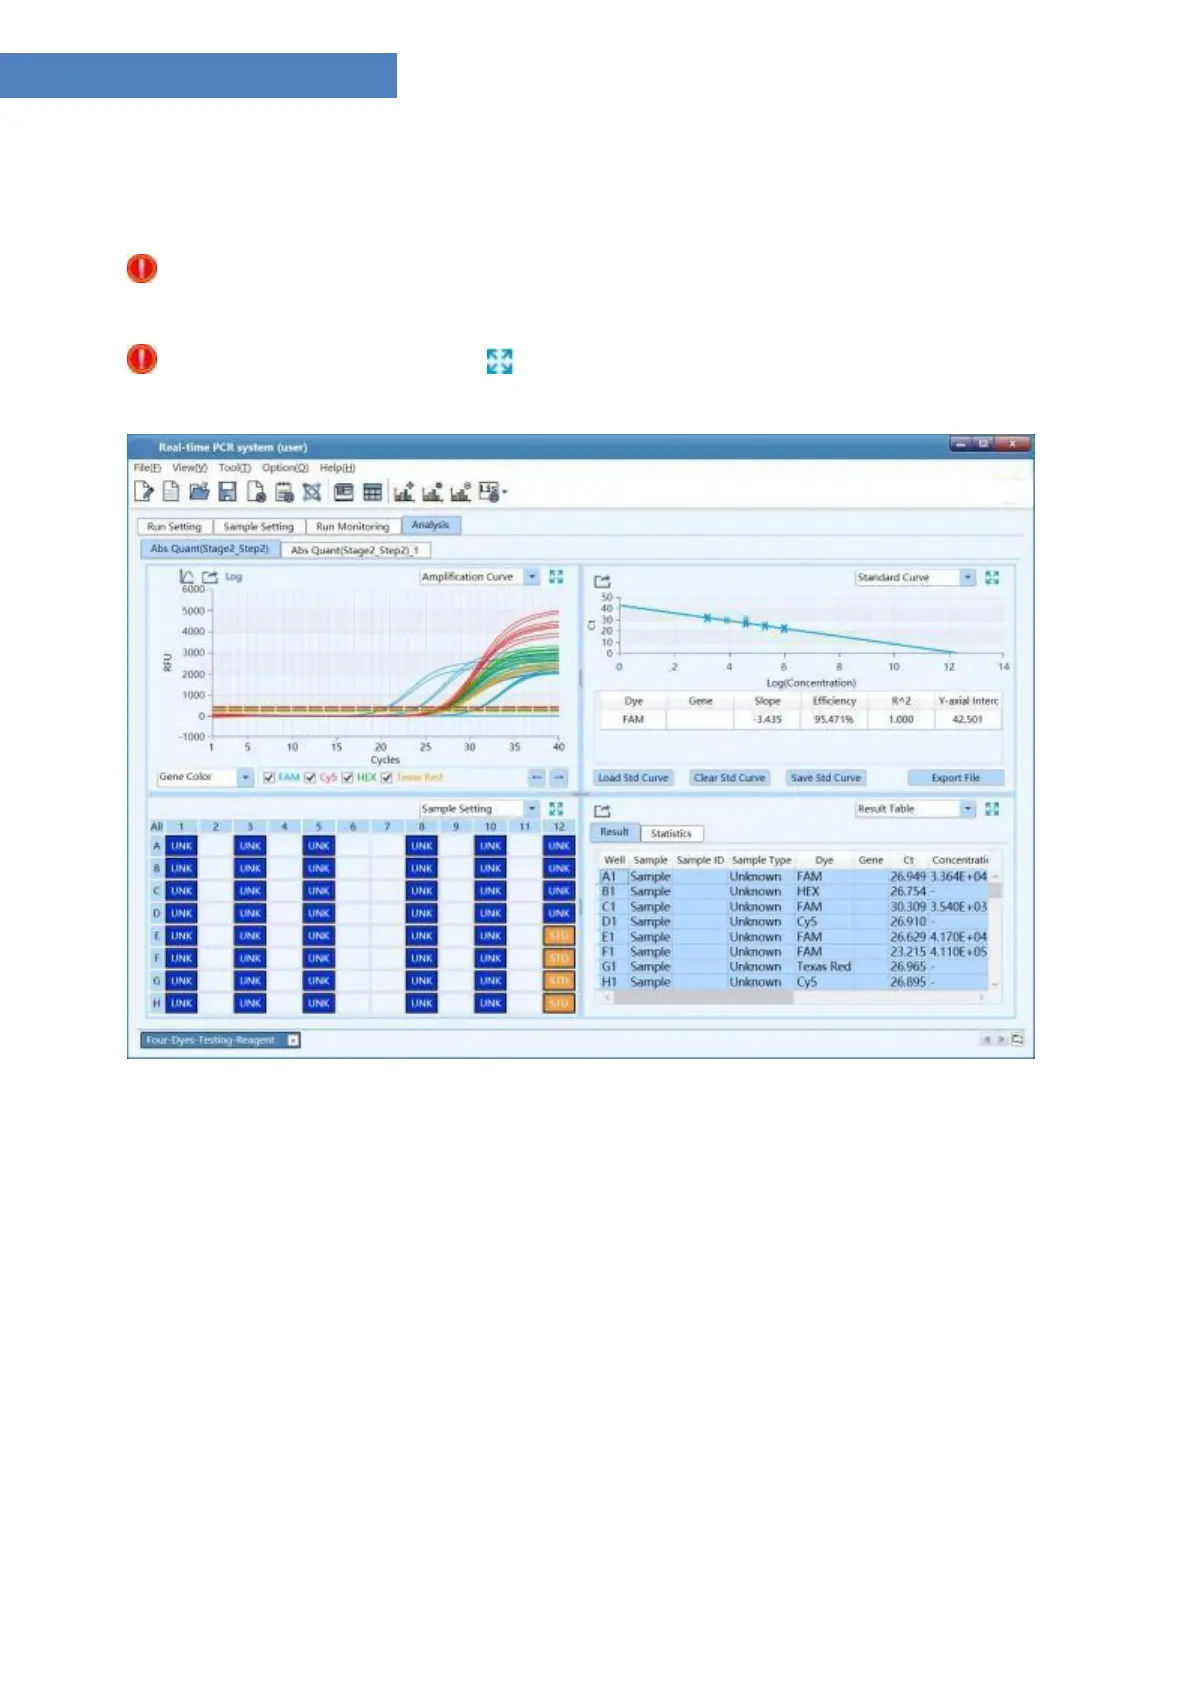
modules (Amplification Curve, Standard Curve, Sample Setting, Result Table) by default, as
shown in figure D-9.
Reminding: user can select the functional module displayed on the analysis interface from
the drop-down list on the top right corner of each area.
Reminding: user can click the < Full Screen > icon on the top right corner of each area
to display the current functional module in full screen.
-
9. Absolute quantification analysis interface
Interface Introduction and Parameter Description
I. Amplification Curve: display the diagram of fluorescence intensity against cycle number
of the current experiment, as shown in figure D-9.1.


 To Next Page