73
Gentier Real-Time PCR System
3.3.4.2 Rel Quant
The relative quantification experiment aims to compare the expression level of two or more
genes within a same individual. Usually, endogenous housekeeping genes with conctant
expression level are taken as the internal reference genes. The relative quantification is realized
by measuring the changes of the target genes expression level related to the internal reference
genes.
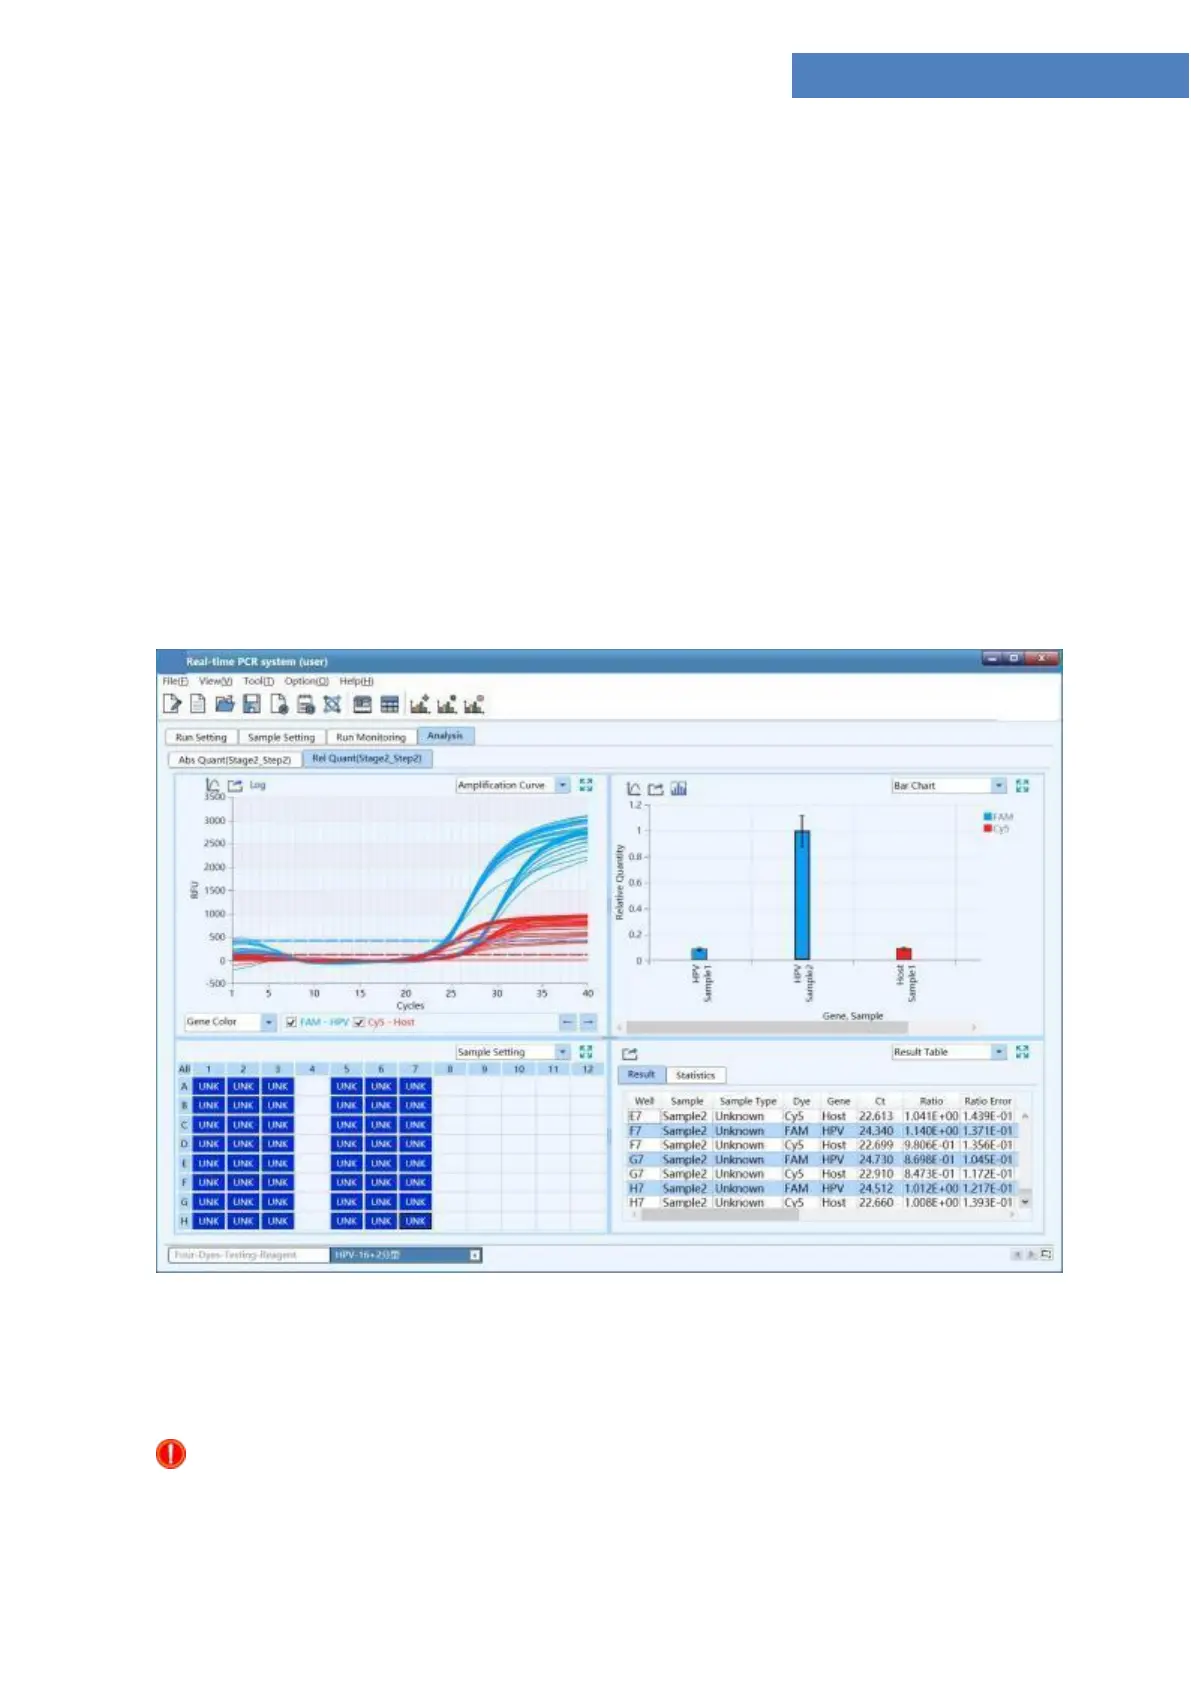
The relative quantification analysis interface consists of eight functional modules:
Amplification Curve, Bar Chart, Sample Setting, Result Table, Standard Curve, Raw Curve,
Raw Fluorescence and Heat Map. This interface is divided into four areas and the application
software displays four functional modules (Amplification Curve, Bar Chart, Sample Setting,
Result Table) by default, as shown in figure D-11.
Figure D-11. Relative quantification analysis interface
Interface Introduction and Parameter Description
Reminding: the parameter descriptions of Amplification Curve, Sample Setting, Result
Table, Standard Curve, Raw Curve, Raw Fluorescence and Heat Map functional modules


 To Next Page