65
Gentier Real-Time PCR System
▶ Parameter introduction:
X axis represents the log concentration of samples;
Y axis represents the threshold Ct value;
Dye: display the relevant dye of standard curve;
Target Gene: display the target gene of standard curve;
Slope: display the slope of standard curve;
Eficiency: display the amplification efficiency of standard curve;
R^2: display the linear regression coefficient square value of standard curve;
Y-axis intercept: display the Y-axis intercept of standard curve;
▶ Function key introduction:
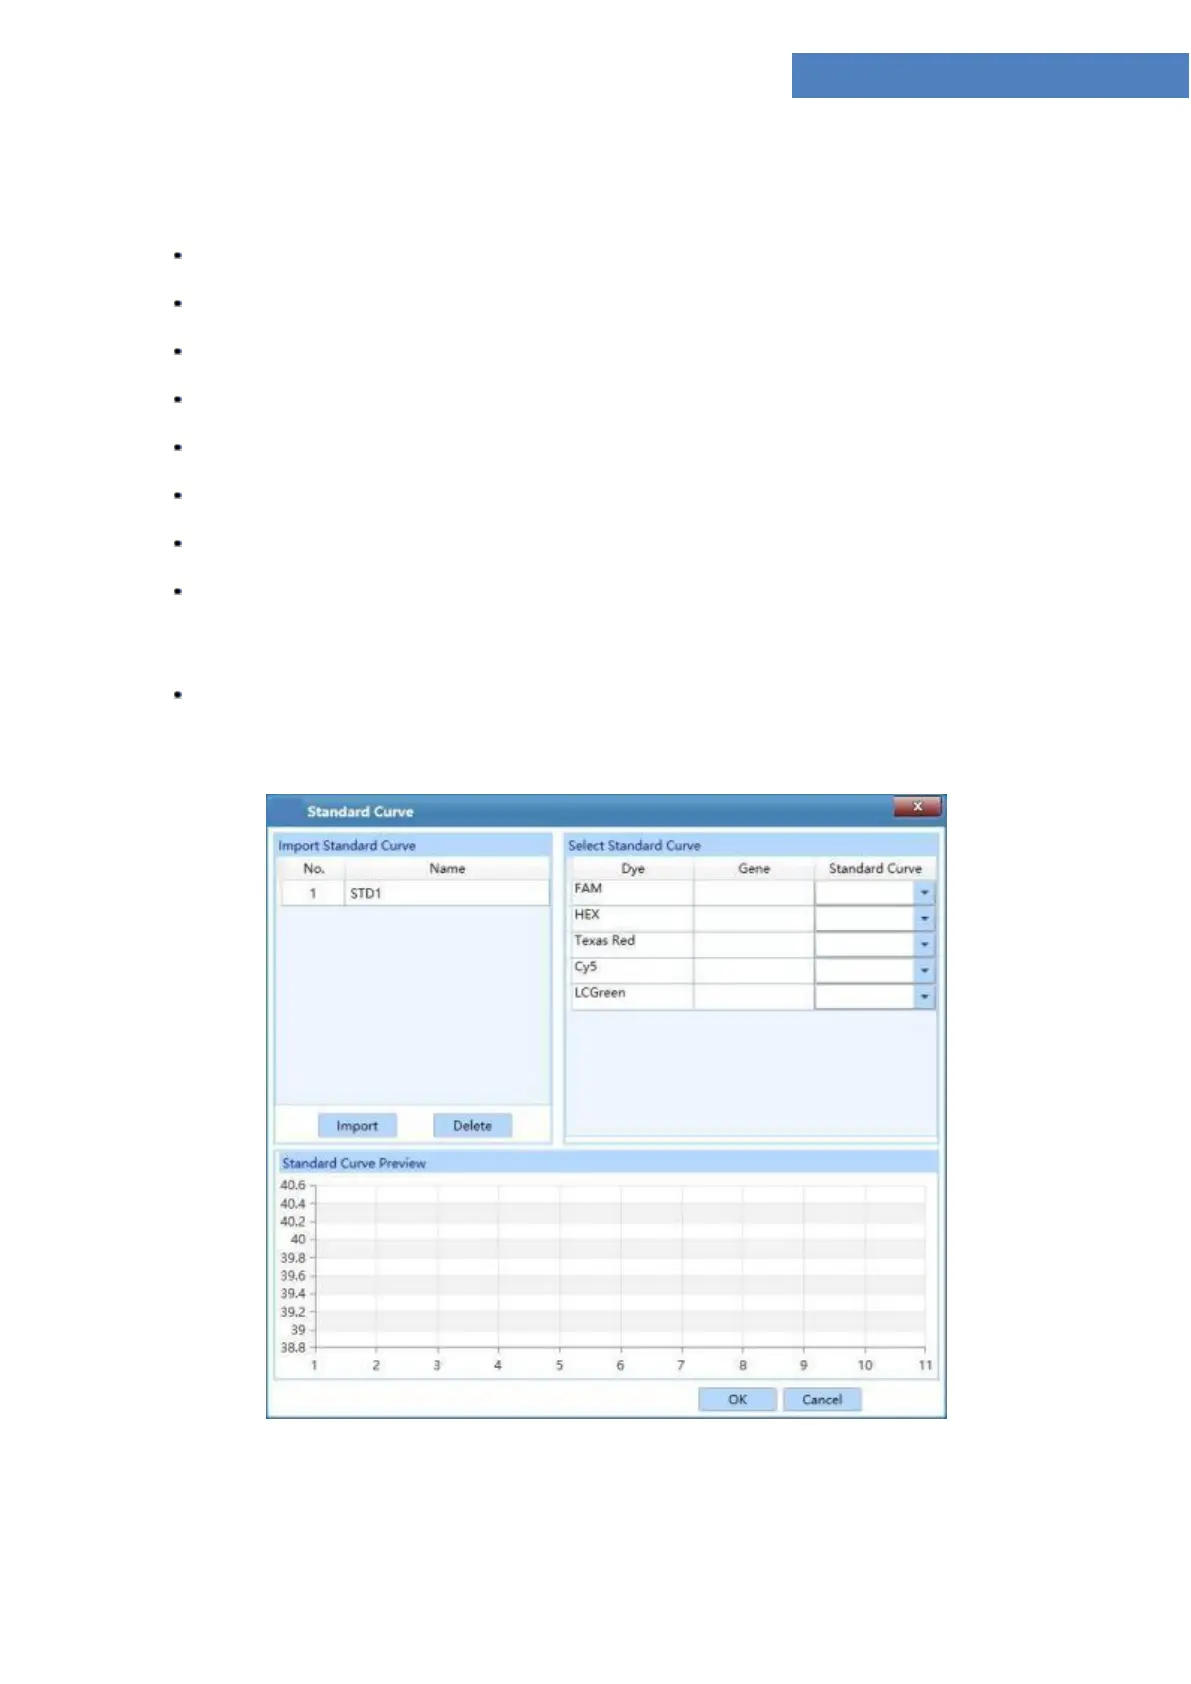
< Load Std Curve >: click < Load Std Curve > and the application software will
automatically pop up the standard curve window, which consists of Import Standard Curve,
SelectStandard Curve and Standard Curve Preview three parts, as shown in figure D-9.2a.
Figure D- 9.2a Abs Quant analysis interface - Standard Curve window
a. Import Standard Curve: user can click < Import > key and select a saved standard curve


 To Next Page