64
Gentier Real-Time PCR System
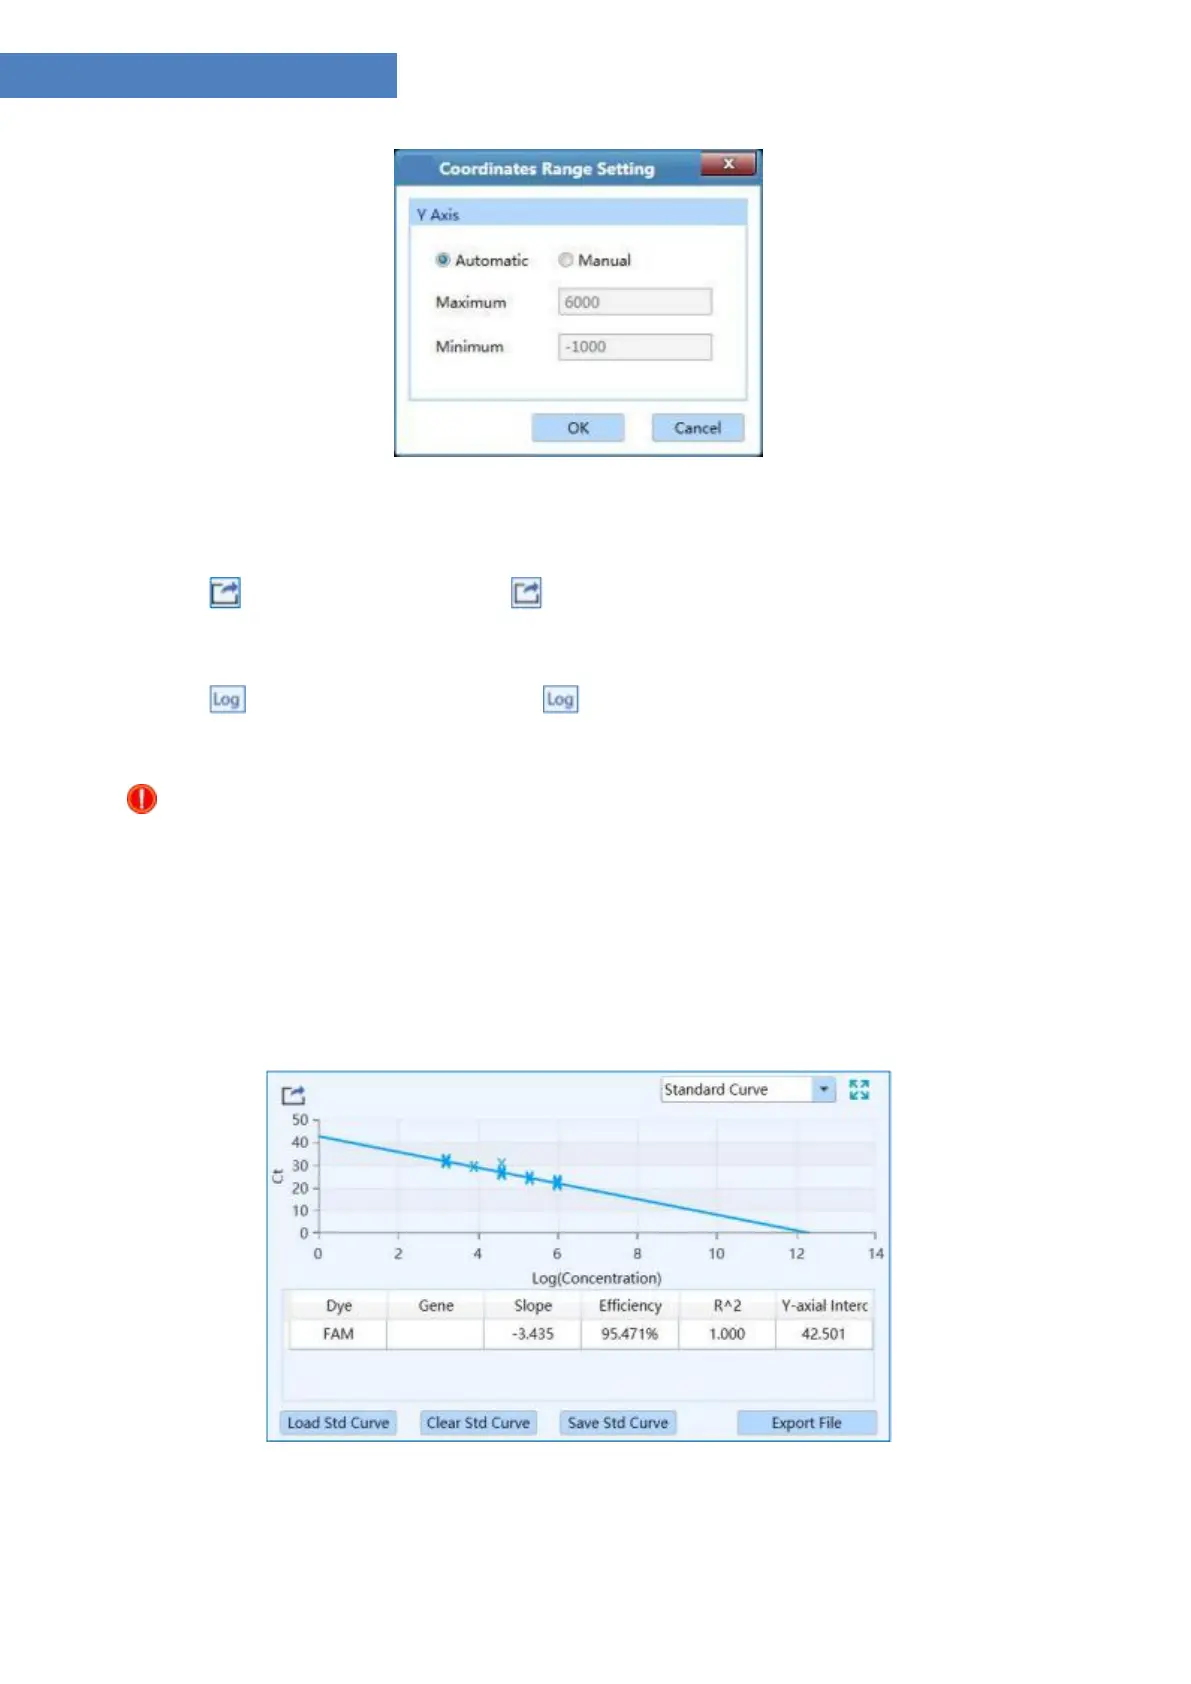
Figure D- 9.1a Abs Quant analysis interface - Coordinate Range Setting
Export >: user can click <
curve diagram.
▶ < Log View >: user can click <
Export > icon to export the current amplification
Log View > icon to view the log image of the
amplification curve diagram.
Reminding: user can hover the mouse over a certain amplification curve, the curve will be
highlighted and its corresponding channel and well coordinate will be displayed on the
right of cursor.
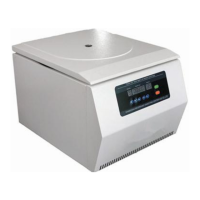
II. Standard Curve: displays the threshold Ct value against the initial nucleic acid quantity of
each standard sample, as shown in figure D-9.2. For absolute quantification, the standard
curve is used to assign initial nucleic acid quantities to unknown samples.
Figure D-9.2 Abs Quant analysis interface - Standard Curve functional module


 To Next Page