70
Gentier Real-Time PCR System
Ct: user can check Ct option and click any dye to view the relevant Ct heat map.
Concentration: user can select Concentration option and click any dye to view the relevant
concentration heat map.
Fluorescence: user can select Fluorescence option and select the cycle number from drop-
down list; then click any dye to view the the relevant fluorescence heat map at certain cycle.
QC: user can select QC option, and if a certain sample or reference conforms to the QC
failure condition set on the Sample Setting interface, then the relevant sample well will be
displayed as N/A on QC diagram.
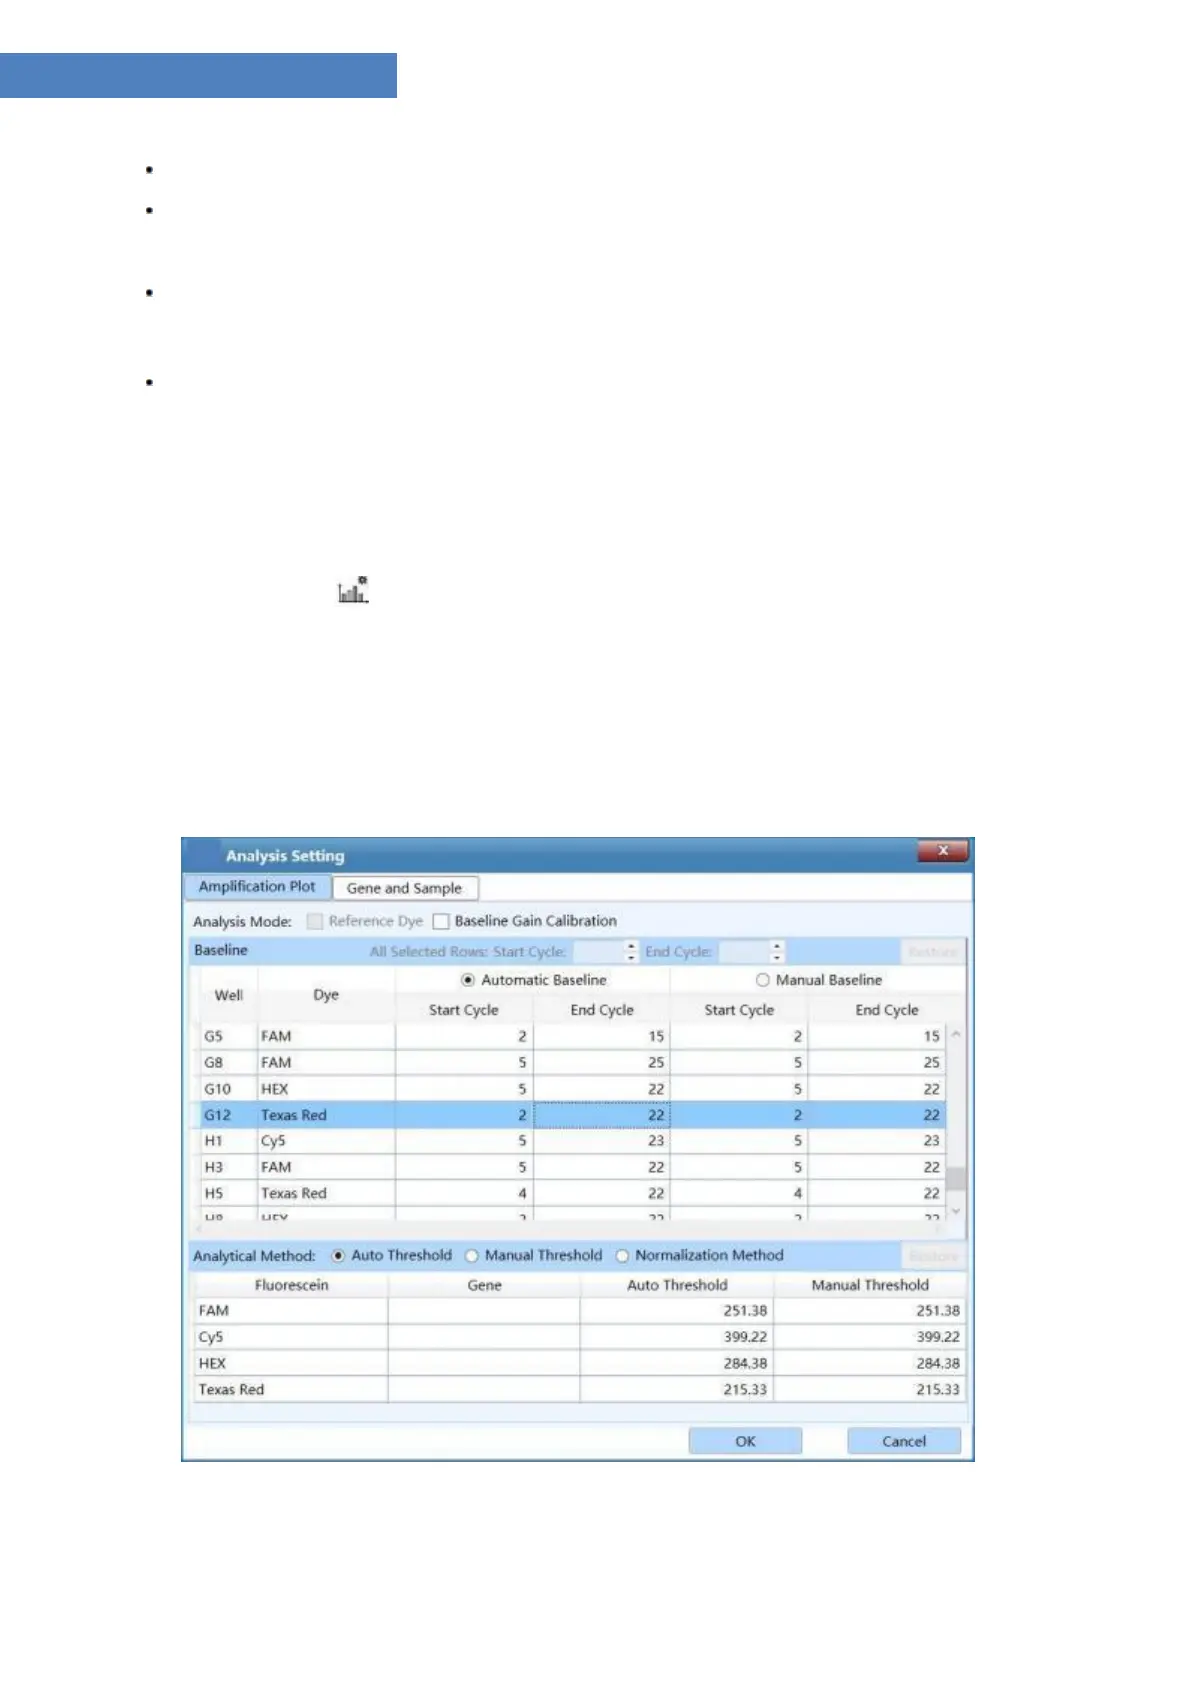
Abs Quant Analysis Setting
User can click the < Analysis Setting > icon in the Tool Bar and the application software
will automatically pop up the analysis setting window, which is composed ofAmplification Plot
and Gene and Sample two tabs. User can set corresponding parameters for the current
experimental data analysis method in the analysis setting window.
I. Amplification Plot tab: user can set the Analysis Mode and Analysis Method of the current
experiment within the Amplification Plot tab, as shown in figure D-10.1.
Figure D-10.1 Abs Quant Analysis Setting interface - Amplification Plot tab


 To Next Page