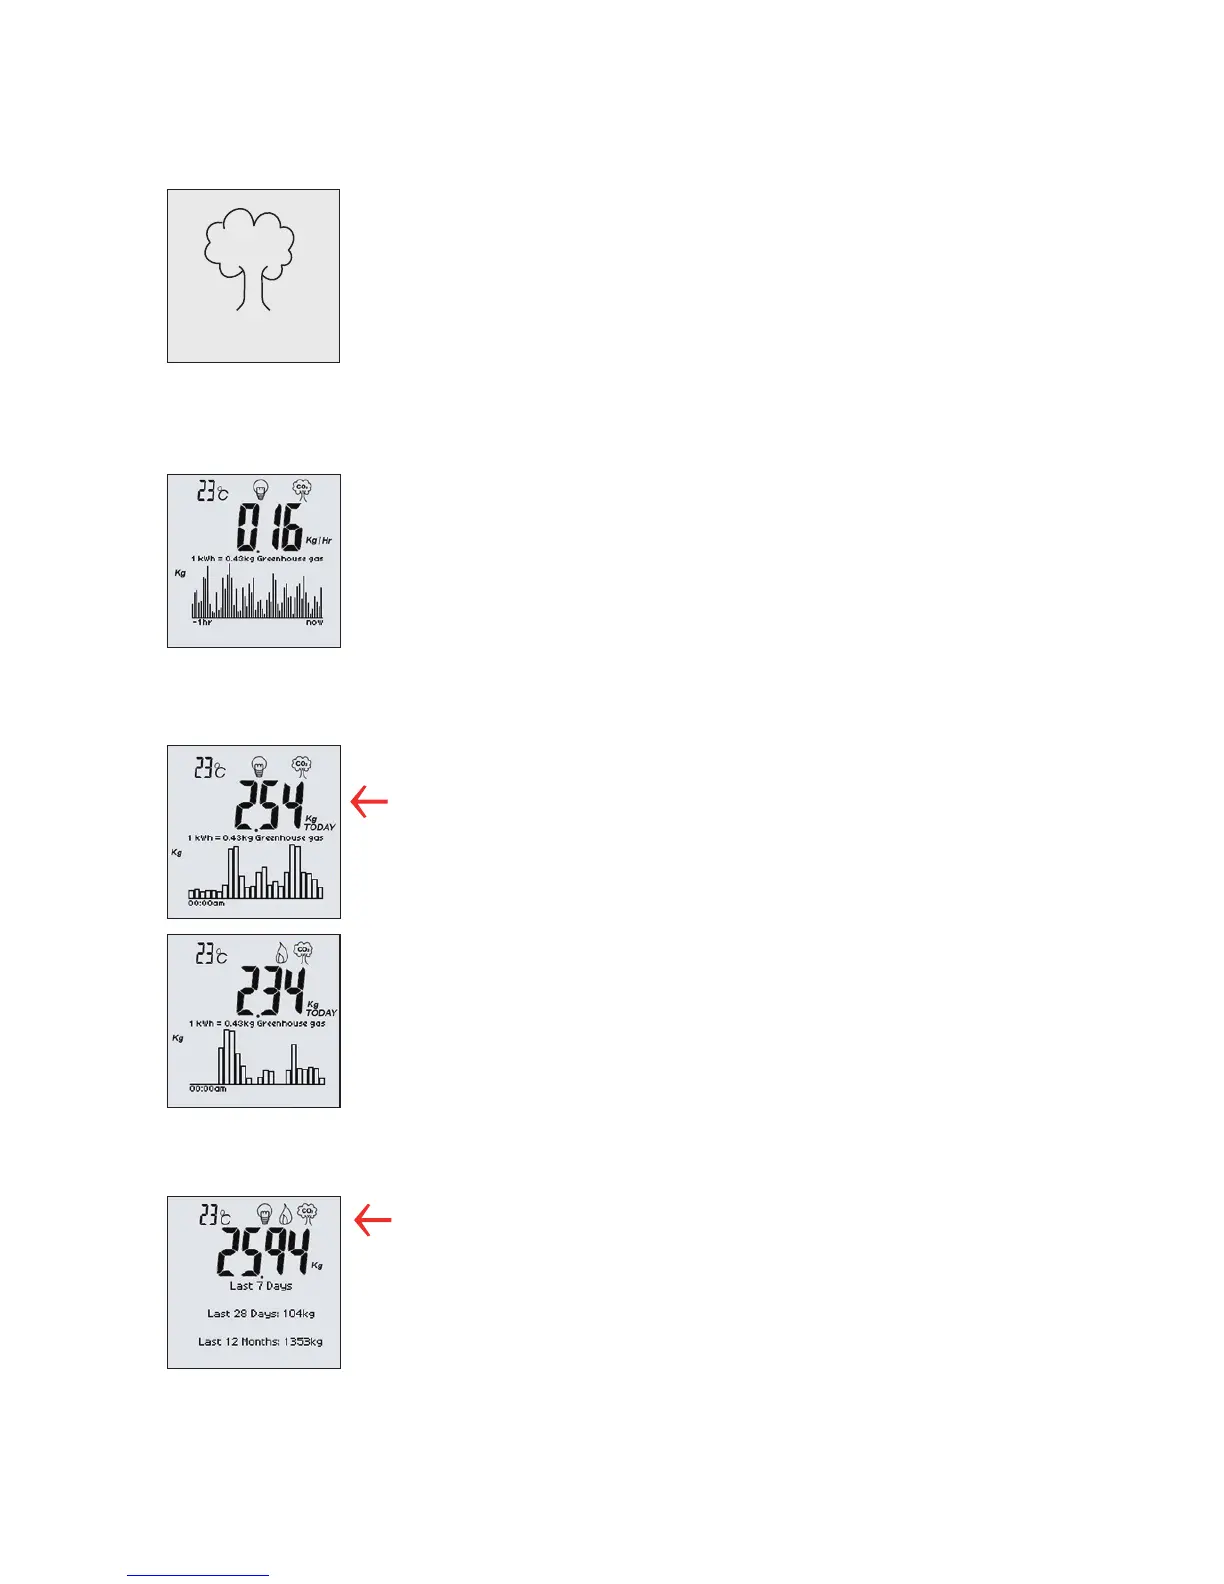
Press the emissions button to view the environmental
impact of your home gas and electricity usage. The
amount of CO
2
emitted per kWh is a variable figure that
depends on the method used for electricity generation
at any given time. The display uses a weighted national
average value. Move through the different screens as
shown below.
Current CO
2
emissions caused by fuel usage
1 x button press
• Emissions per hour in kG of CO
2
at your
current rate of energy usage
• Current figure of CO
2
per kWh of fuel
• Graph showing CO
2
emissions over the
last hour (each bar shows one minute)
Emissions
CO
2
Using your display – CO
2
emissions
Today’s CO
2
emissions caused by usage
Electricity = 2 x button presses (top screen)
Gas = 3 x button presses
(bottom screen)
• CO
2
emissions in kG linked to each type of energy
• Current figure of CO
2
per kWh of fuel
• Graph showing CO
2
emissions today
(each bar shows one hour)
Total CO
2
emissions over the last 7 days,
28 days and 12 months
4 x button presses
• These three totals show the CO
2
emissions
combined for both fuel types
11


 To Next Page