EIT Part Number: P/N IM-0110 Rev A Issued April 2019
Page 5
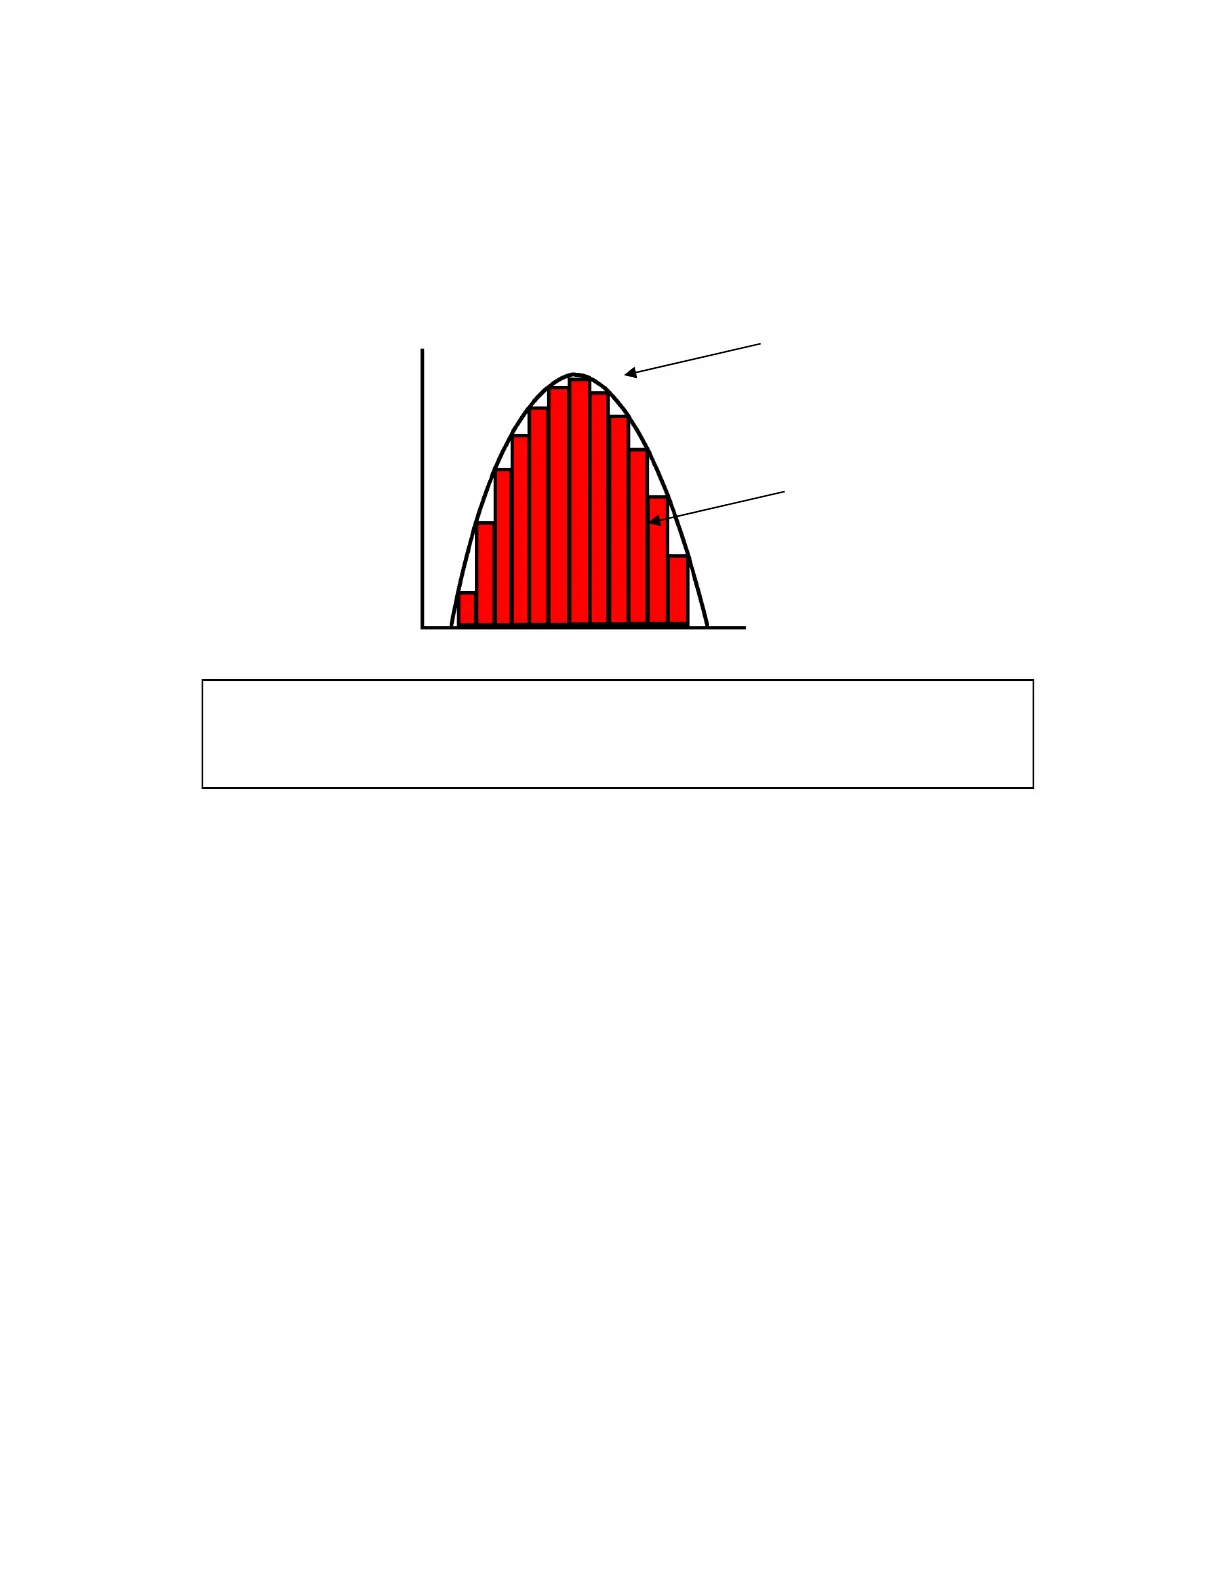
If you were to chart irradiance on a vertical (Y) axis against time on the horizontal (X) axis, energy density is equal
to the area under the curve (shown in red below) or the mathematical integration of lamp intensity over time. The
MicroCure
derives this value by measuring the lamps irradiance many times during the data-collection run and
then summing these values together.
Energy Density is the total amount of energy exposure over time. It is the mathematical
calculation of the area under the irradiance curve. The instrument calculates energy density
by adding many irradiance samples together. The numerical irradiance reported is the peak
irradiance value recorded by the instrument
Time
Power / Irradiance
Peak Irradiance (W/cm
2
)
Area under the curve
(J/cm
2
)