114
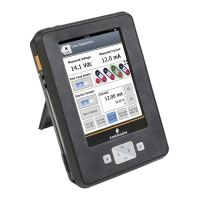
Figure C-3. Strip/sweep/scope chart example
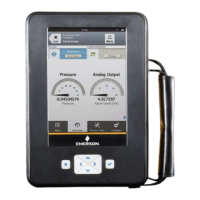
Horizontal bar charts
A horizontal bar chart formats device data into bars from left to right
and
varies with time. Use the drop-down list to select the variable you
want to highlight. Additional horizontal bars may be present if more
than one variable is defined for the option you selected in the
drop-down list. The selected variable from the drop-down list appears
in color and has a black dot at the end of it. The colors displayed are
determined by the device description and may vary between devices.
The labels and axis displayed are determined by the device
manufacturer.
The chart update rate is determined by the device manufacturer. The
def
ault chart update rate is 1 second.
Figure C-4. Horizontal bar chart example