115
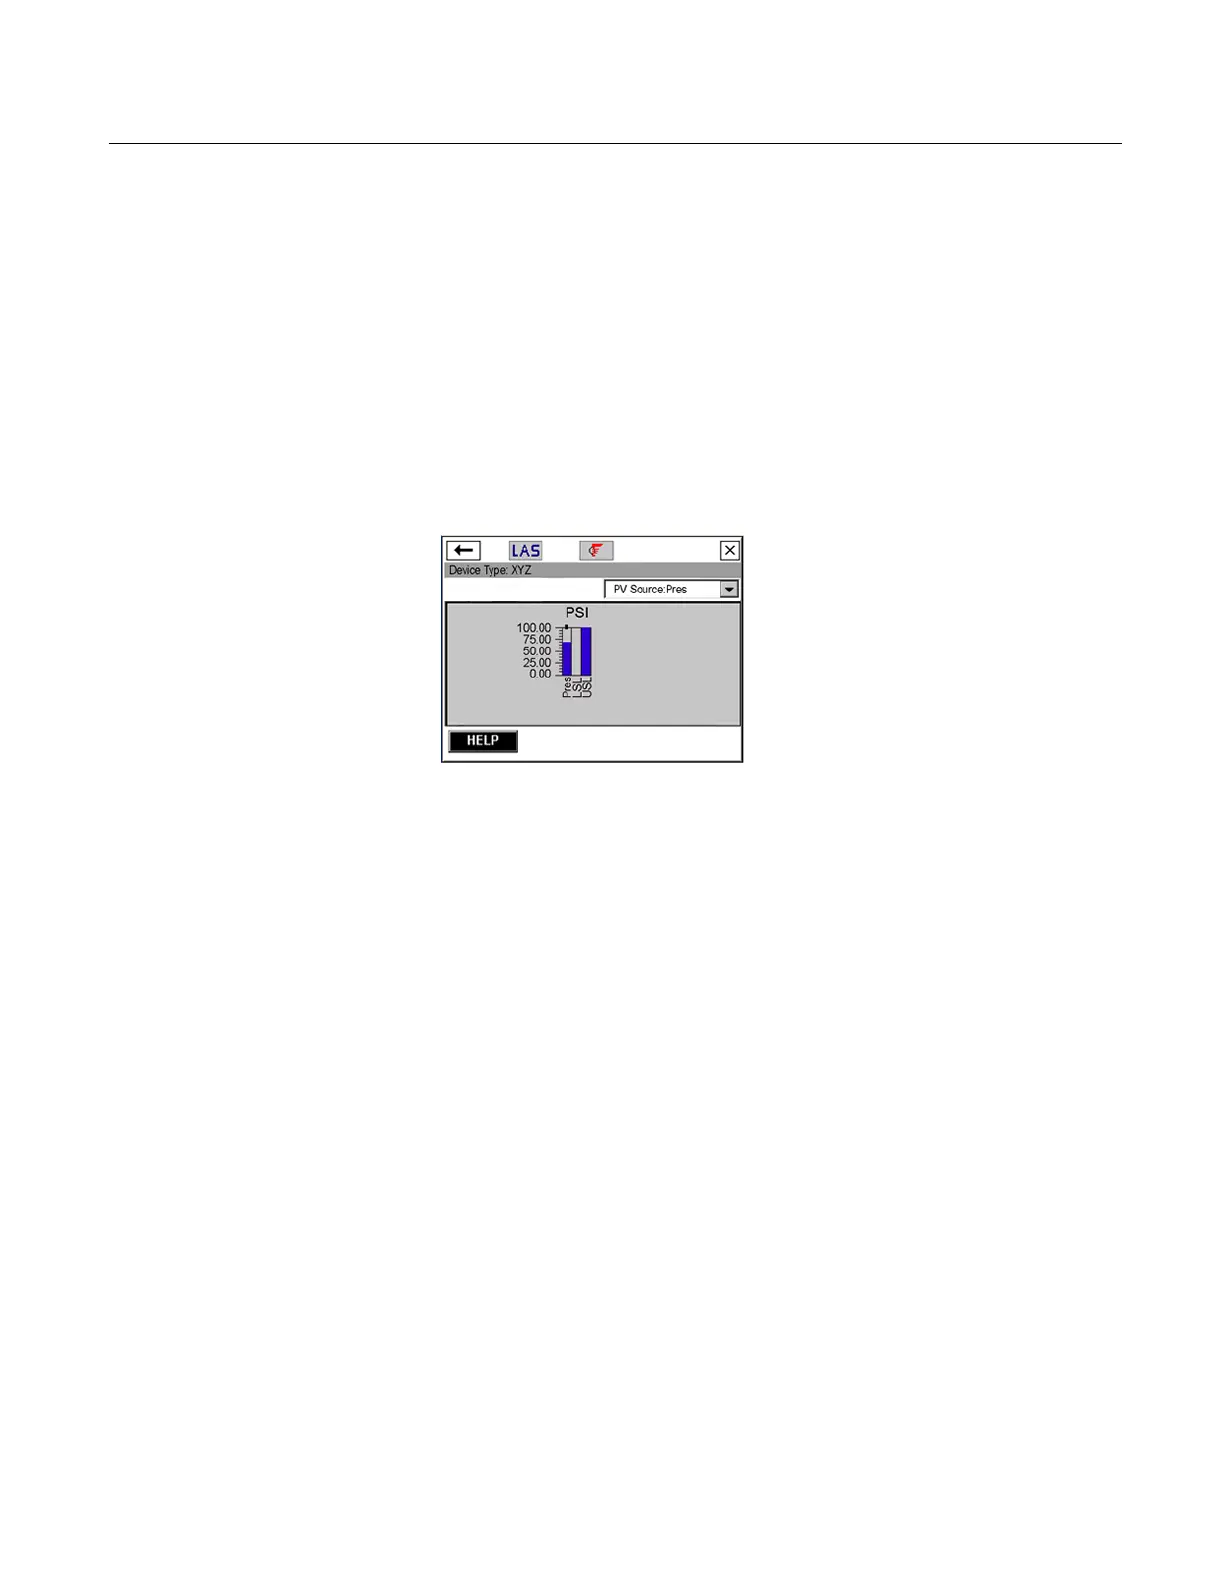
Vertical bar charts
A vertical bar chart formats device data into bars from bottom to top
and
varies with time. Use the drop-down list to select the variable you
want to highlight. Additional vertical bars may be present if more than
one variable is defined for the option you selected in the drop-down
menu. The selected variable from the drop-down list appears in color
and has a black dot above it. The colors displayed are determined by
the device description and may vary between devices.The labels and
axis displayed are determined by the device manufacturer.
The chart update rate is determined by the device manufacturer. The
def
ault chart update rate is 1 second.
Figure C-5. Vertical bar chart example
Gauge charts
A gauge chart formats device data into a view similar to an analog car
speedometer
and plots device data varying with time. Use the
drop-down list to select the variable you want to highlight. Additional
gauge needles may be present if more than one variable is defined for
the option selected in the drop-down list. The selected variable from
the drop-down list appears as a long, colored needle while the other
variables appear as short, colored needles. The colors displayed are
determined by the device description and may vary between
devices.There can only be a maximum number of three variables per
gauge chart. The labels and axis displayed are determined by the
device manufacturer.
The chart update rate is determined by the device manufacturer. The
def
ault chart update rate is 1 second.