32 33
is the square root of the mean of the squares of the
successive differences between adjacent heart’s beat-
to-beat intervals.
In the scientific literature RMSSD is widely accepted as
a measure of parasympathetic nervous system (PNS)
activity. According to Wikipedia, PNS is responsible for
stimulation of “rest-and-digest” or “feed and breed”
activities that occur when the body is at rest, and com-
plementary to that of the sympathetic nervous system
(SNS), which is responsible for stimulating activities
associated with the fight-or-flight response.
For ecient recovery from training and stress, it is es-
sential that parasympathetic nervous system is active,
and our body gets sucient rest and replenishment.
With HRV RMSSD value one can monitor what his/her
general baseline value is and see how heavy exercise,
stress, etc. factors influence it, and see when the value
gets back to baseline, indicating for example capability
to take another bout of heavy exercise. RMSSD can be
measured in different length time windows and in dif-
ferent positions, e.g. supine, sitting or standing.
Morning RMSSD value presented here is average of all
3 minute window RMSSD values measured during last
90 minutes prior to waking up. This should give you in-
dication of how ready and well rested your body is for
the new day. Evening value is similarly measured within
first 90 minutes in bed.
For more detailed analysis of full night HRV data you
can delve in to the details by using arrow button next
to i-button.
RMSSD value is highly individual and depends on age,
gender, fitness level, stress level, lifestyle choices, etc.
For this reason, one should monitor values for a few
weeks, and only aer that make conclusions on what
kind of implications different values have for him/her.
Generally, higher values indicate better health, fitness,
etc. In short term RMSSD indicates readiness for the
day, and in long term, for example along with training,
RMSSD values tend to climb up.
Long term decrease in RMSSD may be indication of
approaching over training condition.
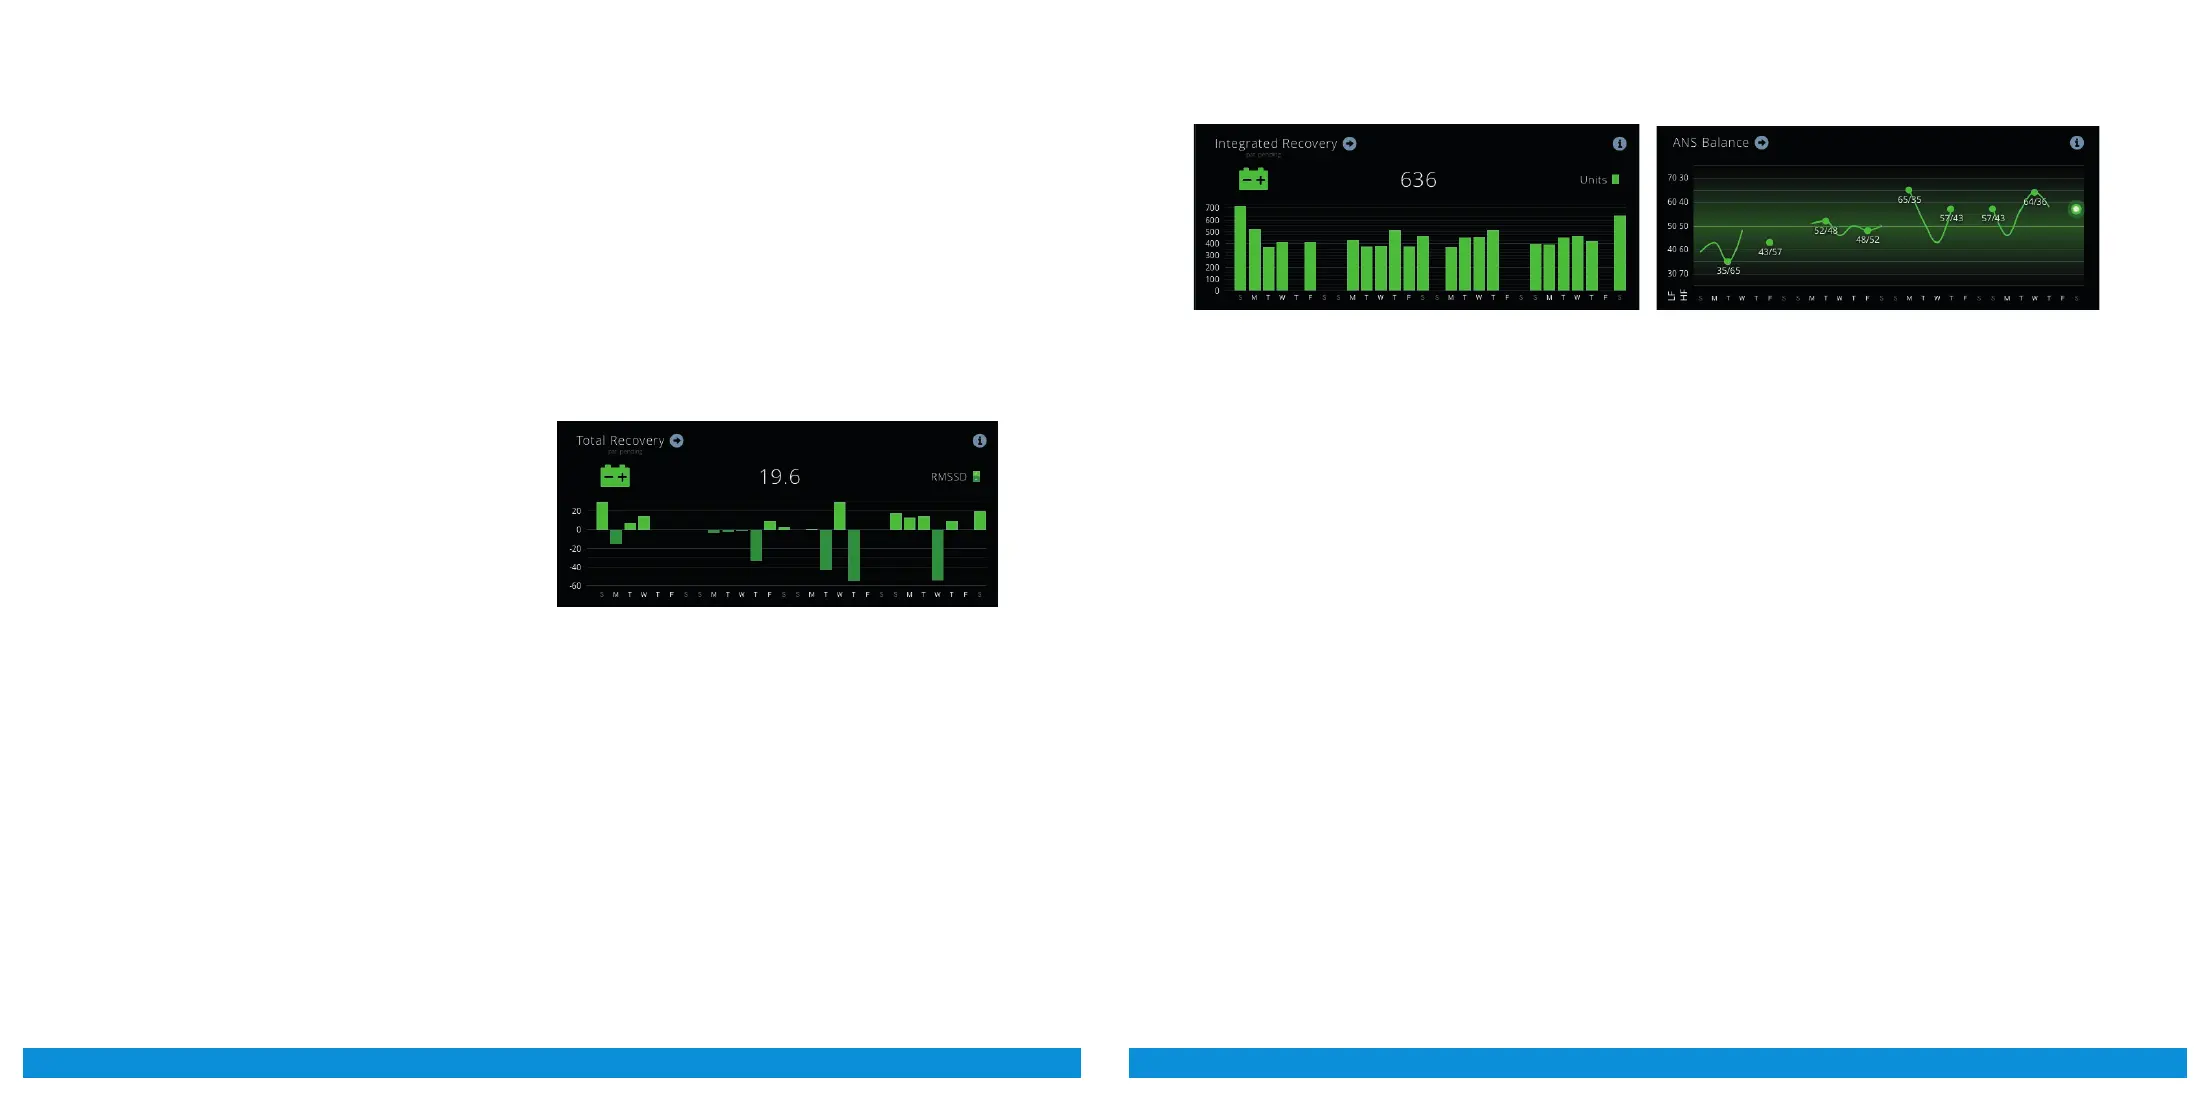
5. TOTAL RECOVERY
Total Recovery is simply difference between morning
and evening RMSSD values. Usually it should be posi-
tive, indicating that there has been ecient recovery and
resting during the night.
Of course, this should be analyzed with regard to activ-
ities of previous day: if previous day was very light (no
stress, no heavy exercise) and evening RMSSD is rela-
tively high, it is not reasonable to expect high Recovery
number, because there is no load to recover from.
Values of Recovery are highly individual, and you
should inspect them against your own baseline values,
and also in comparison to Evening RMSSD values.
6. INTEGRATED RECOVERY
Integrated Recovery is the area remaining under the
RMSSD graph, and in some sense it indicates how
much recovery you gain during the whole night. For ex-
ample, some people may start to recover very nicely
(RMSSD graph shooting upwards) during early hours
of the night, aer they go to bed and fall asleep, but to-
wards the morning hours they may start become anx-
ious (for example because of work stress), and their
RMSSD starts to decline. As a result, morning RMSSD
may be quite low when compared to evening RMSSD,
thus indicating poor recovery, even though during
the night there has been some good recovery. This is
where integrated recovery steps in, as it indicates also
this good recovery earlier in the night.
Integrated Recovery and Total Recovery should be
checked together; even if Total Recovery is low, but
Integrated Recovery is medium or high with regard to
ones own history, then there has been some recovery.
On the other hand, if they both are low, then recovery is
propably not sucient, and one should avoid stressing
him/herself too much, for example, avoid very heavy
physical exercise.
7. ANS BALANCE
Autonomic Nervous System Balance tells whether the
user is too excited (high LF value) or too phlegmatic
(high HF value).
LF and HF refer to Low Frequency and High Frequency,
respectively, and they both are common frequency do-
main measures of heart rate variability.
LF is the area measured in a frequency band of 0.04-
0.15 Hz, and it is considered as a state indicator of both
sympathetic/parasympathetic nervous systems.
HF is the area measured in a frequency band of 0.15-
0.4 Hz, and it is considered as a state indicator of par-
asympathetic nervous systems.
In our system we use normalized units LFn and HFn,
and the normalized units have been expressed as a
percentage of the sum of LF+HF, i.e. LFn=LF/(LF+HF).
Diagram displays both LFn and HFn, and ideally, the
indicator should stay near the 50-50 shaded line be-
tween values of 25 and 75.
Deviation beyond 25-75 or 75-25 line may be indica-
tion of insucient recovery, high or chronic stress, gen-
eral fatigue or some other malfunction in your body.