34 35
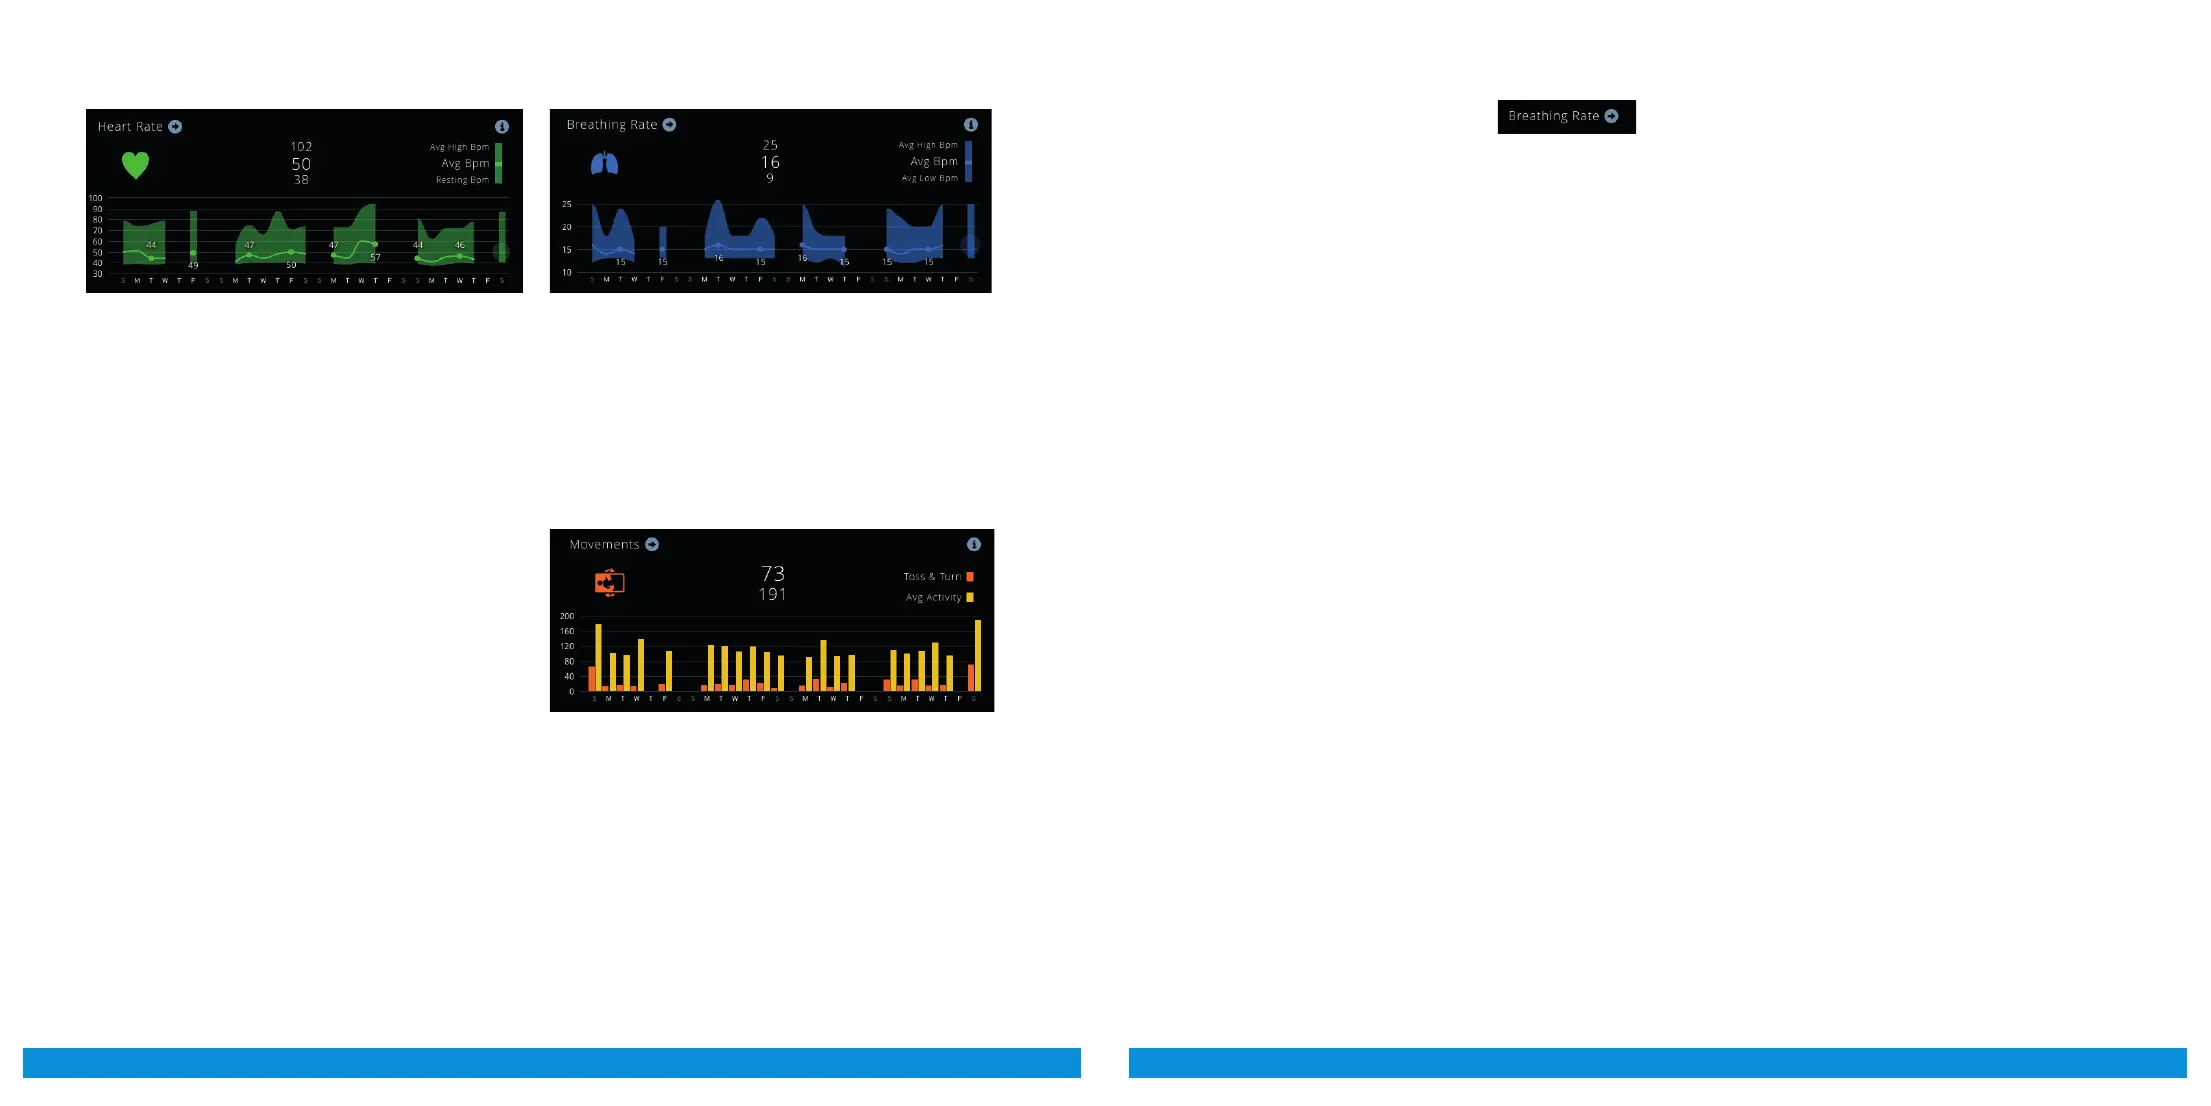
8. HEART RATE
Avg BPM is simply average heart rate for the whole
night.
To find the Resting BPM, your average heart rate is
computed for every three-minute time window during
the whole night, and the smallest value is chosen out
of all these. In other words, it is the smallest 3-minute
average heart rate you had during sleep.
Resting BPM can be used as a mild indication of stress
or overtraining. Aer you have established your base-
line Resting BPM during a couple of weeks, you can
check out for notable deviations from this norm.
General rule of thumb is that if your Resting BPM
bumps up more than 7 beats per minute, you should
consider skipping the exercise or exercise little bit
lighter, and find some means to relieve your stress. The
same rule applies also if there is a notable decrement
in Resting BPM value.
Rapid changes in Resting BPM should not be confused
with long-term changes. For example, physical exer-
cise tends to decrease resting heart rate over time, and
this only tells that you are getting more fit!
9. BREATHING RATE
Avg BPM is simply average respiration rate for the
whole night. The typical respiratory rate for a healthy
adult at rest is 12–20 breaths per minute. Respiration
rates may increase with medical conditions, such as
fever or illness, and rise in Avg BPM may indicate this
condition.
10. MOVEMENTS
Avg Activity measures larger movements than those
caused by heart beating and respiration, such as
twitching leg or arm or changing position only slightly.
Bigger movements of your body are indicated by num-
ber Toss & Turn.
Higher value both in Avg Activity and Toss & Turn might
indicate restless night, and these should be inspected
against your own baseline values. Long term increase
in these numbers may be indication of approaching
over training condition.
13.2. More detailed information accessible
through arrow button
• Sleep Classes. Shows sleep architecture and bed exits.
From this figure the user can see how different sleep class-
es are distributed throughout the night. Usually deep sleep
phases should occur in 90-120 minute cycles, 4-6 times
during the night. Alcohol or drug use, heavy training, or
stress may change the pattern.
• Heart Rate / Respiration Rate. This figure helps to see
when and how deep person’s heart and respiration rate
gets. Healthy individual should see clear pattern where
heart rate goes down as sleep deepens, and goes up in light
sleep and REM sleep.
• Activity / Turns. Gives indication how restless sleep has
been. If there is lots of activity and turns, sleep quality is
probably poor too.
• Nervous System Balance. This should remain generally
near 50 %. If it peaks oen over 25/75 % line, or it leans
continuously to other side, one should consider relaxing (in
case of high LF) or stimulating (in case of high HF) himself
a little bit.
• RMSSD / Heart Rate. This tab gives most information to
the athlete. Aer heavy exercise the evening RMSSD should
be clearly down from the baseline (this can be used as in-
dication of exercise load), and towards the morning there
should be rising and fluctuating trend. This tells about the
recovery rate during the night. If curve trends downwards,
one may be getting ill, having digestive problems, sleeping
bad, or stressing about work, relationship, or something else.
Ideally RMSSD curve should be either horizontal (if there is
no stress / exercise to recover from), or it should form rising
trend towards morning (indicating healthy recovery).
NOTE! All screens have history of seven last days graphically displayed,
which makes it easy to see where one goes each day in relation to other days.
RMSSD GRAPH (ESPECIALLY USEFUL FOR ATHLETES)
At dashboard, seven days mini graphs should give instant-
ly indication how this particular day is in relation to earlier
days, and whole night RMSSD graph gives useful informa-
tion about daily loads and recovery during the night time.
Here is short information about how to interpret whole night
RMSSD graph:
In this graph we display total recovery in terms of RMSSD
value, and also speed of recovery as RMSSD units / hour.
This should give several kinds of information:
1) If Evening RMSSD value is low (enough), it is indication
that exercise has been (suciently) heavy.
2) If Morning RMSSD value is high (enough), it is indication
that recovery throughout the night has progressed as ex-
pected, and you are ready for another heavy exercise.
3) If graph has upward trend, and Recovery Ratio is clearly >
1 there has been recovery during night.
4) If graph is mostly horizontal and Recovery Ratio is around
1, there probably has been no load nor recovery.
5) If graph has downward trend and Recovery Ratio is
clearly < 1, it might be indication of uncontrollable stress, or
about some physical condition (some sickness creeping in,
digestive problems, overreaching, etc.)
This information might help you to adjust your training load.
Also resting HR value is useful, if it suddenly bumps up,
there might be something wrong in your body.
RMSSD graph should consist of equally spaced dots (one
at every 3 mins, 20 dots / hour). If there are missing dots,
it is indication of bad signal. In this case you should check
the location of sensor, so that it is directly under your chest
while you sleep.