4
formula is established:
Input power (P
PV
)= Output power (P
Bat
)
Input voltage (V
Mpp
) *input current (I
PV
) =Battery voltage (V
Bat
) *battery current (I
Bat
)
Normally, the V
Mpp
is always higher than V
Bat
, Due to the principle of conservation of
energy, the I
Bat
is always higher than I
PV
. The greater the discrepancy between V
Mpp
&V
Bat,
the greater the discrepancy between I
PV
& I
Bat
. The greater the discrepancy
between array and battery, the bigger reduction of the conversion efficiency of the
system, thus the controller‘s conversion efficiency is particularly important in the PV
system.
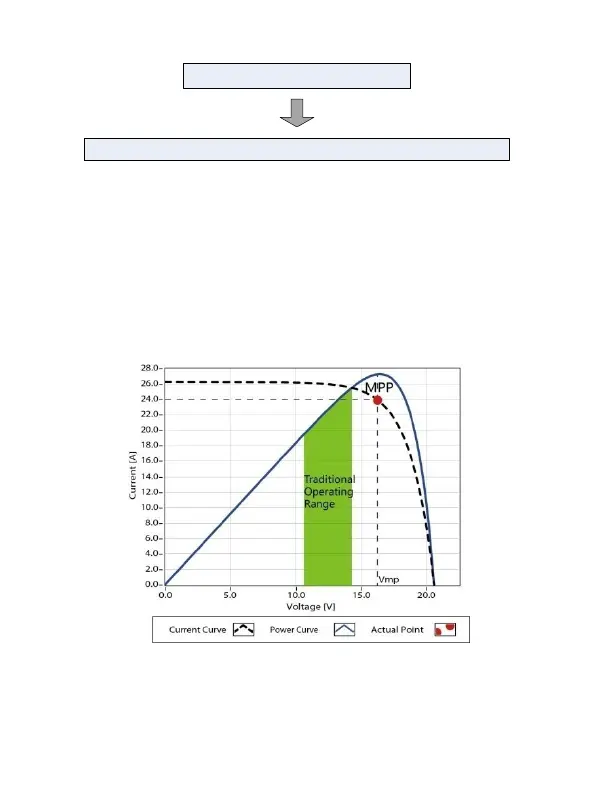
Figure 1-2 is the maximum power point curve, the shaded area is charging range of
traditional solar charge controller (PWM Charging Mode), it can obviously diagnose
that the MPPT mode can improve the usage of the solar energy resource. According
to our test, the MPPT controller can raise 20%-30% efficiency compared to the PWM
controller. (Value may be fluctuant due to the influence of the ambient circumstance
and energy loss.)
In actual application, as shading from cloud, tree and snow, the panel maybe appear
Multi-MPP, but in actually there is only one real Maximum Power Point. As the below
Figure 1-3 shows:
Figure 1-2 Maximum Power Point Curve
 Loading...