www.evofitness.net.au
8
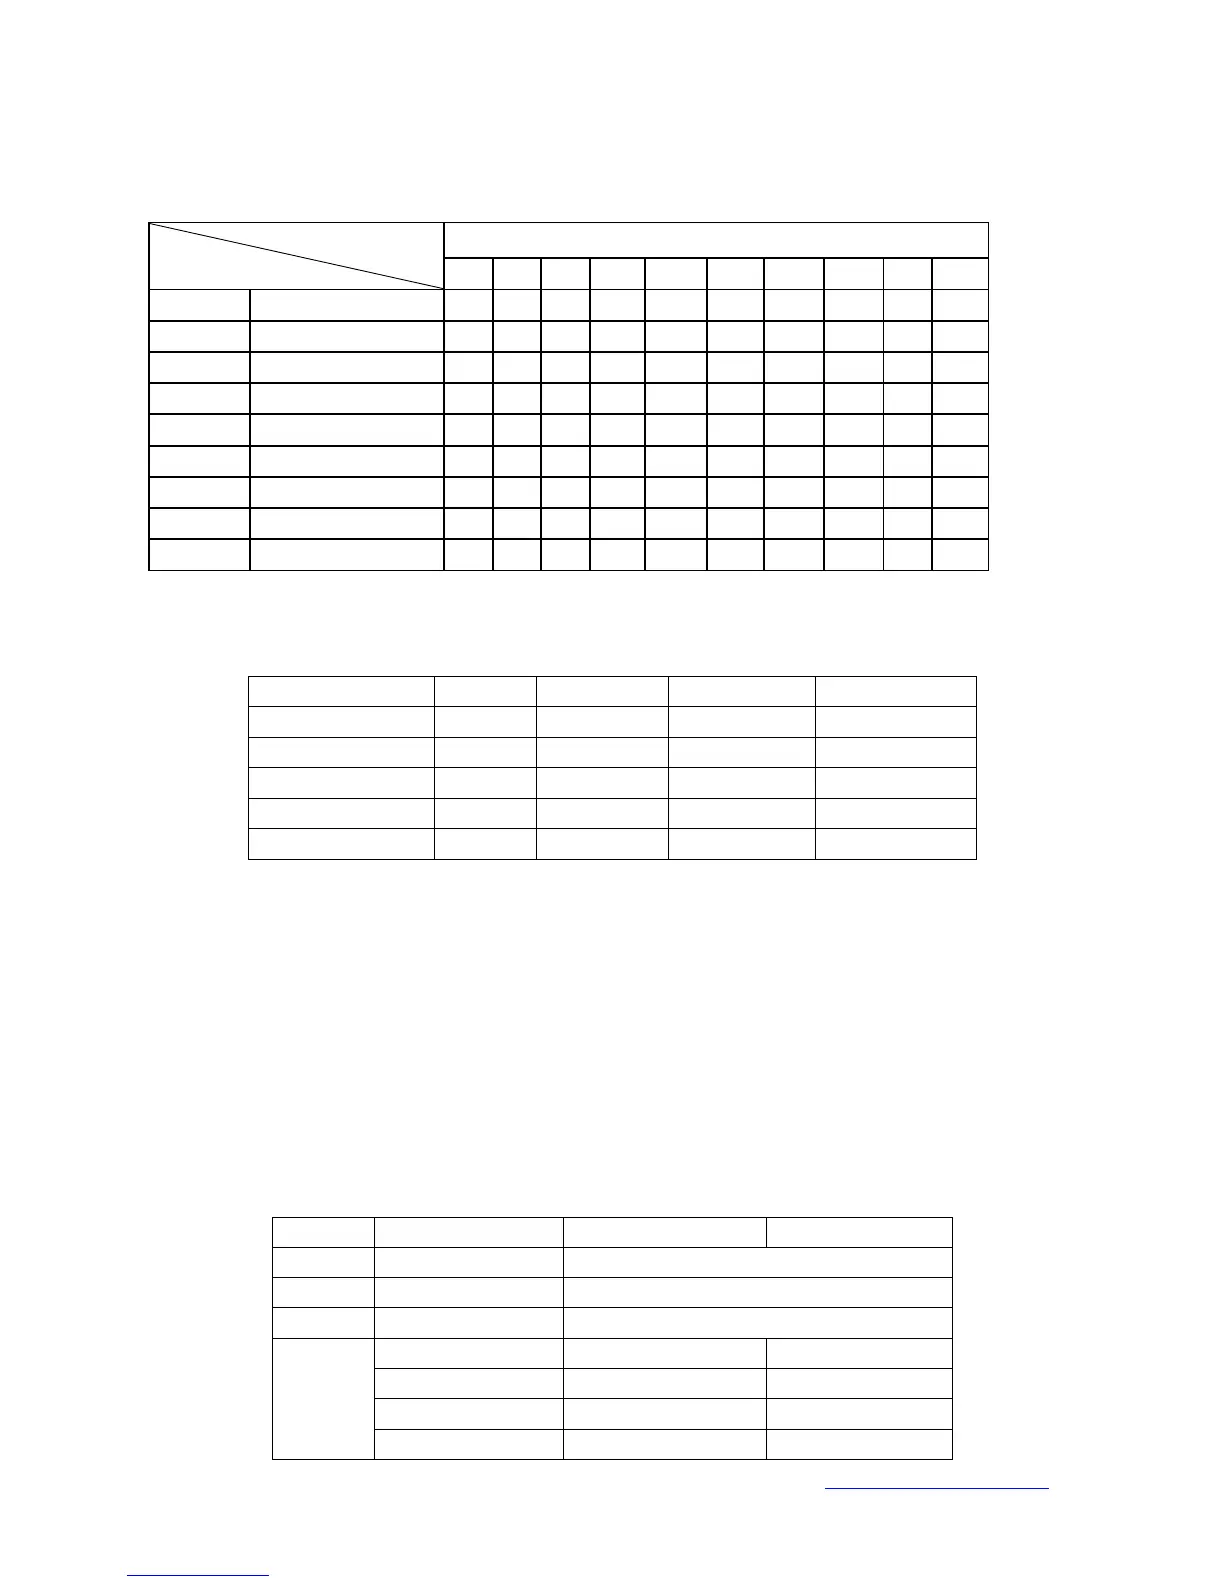
Program exercise chart
Each program will divide into 10 grades for the exercise time and each time sect has the speed
accordingly.
Range of program
PROGRAM BEGIN SET UP RANGE DISPLAY RANGE
TIME(MIN:SECOND) 0:00
15:00 5:00-99:00 0:00-99:59
SPEED(K/h)
1.0 1.0 1.0-16 1.0-16
DISTANCE(K)
0 1.0 0.5-99.9 0.00-99.9
PULSE(hypo/min)
P N/A N/A 40-200
CALORIE(THERM)
0 50 10-999 0-999
BODY FAT TEST:
In the beginning stage, press “PROGRAM” continually entering ‘BODY FAT TEST’, press “MODE” enter
F-1, F-2, F-3, F-4, F-5 (F-1 SEX, F-2 AGE, F-3 HEIGHT, F-4 WEIGHT, F-5 FAT TEST),
Press “SPEED+” “SPEED -” to set F-1 – F4 (refer to the following chart), after that, press “MODE” to set
F-5, grasp the palm pulse, the window will display your body mass index after 3 seconds. The body
mass index is to test the relation between height and weight. The BMI test is designed for any male and
female use. The ideal BMI should be between 20-25, if under 19, it is showing you are underweight. If
between 25 and 29, it is showing you are overweight, if over 30, obese. (The data is just for reference;
this can not be as medicinal data)
F-1 Sex 01 male 02 female
F-2 Age 10------99
F-3 Height 100----200
F-4 Weight 20-----150
F-5
FAT ≤19 Underweight
FAT =(20---25) Normal weight
FAT =(25---29) Overweight
FAT ≥30 Obesity
MODE TIME
TIME INTERVAL
1 2 3 4 5 6 7 8 9 10
P1 SPEED 2 4 3 4 3 5 4 2 5 3
P2 SPEED 2 5 4 6 4 6 4 2 4 2
P3 SPEED 2 5 4 5 4 5 4 2 3 2
P4 SPEED 3 6 7 5 8 5 9 6 4 3
P5 SPEED 3 6 7 5 8 6 7 6 4 3
P6 SPEED 2 8 6 4 5 9 7 5 4 3
P7 SPEED 2 6 7 4 4 7 4 2 4 2
P8 SPEED 2 4 6 8 7 8 6 2 3 2
P9 SPEED 2 4 5 5 6 5 6 3 3 2