Page 11 of 24
Gauge
The “Gauge” to the right of the screen displays the current CRI reading in a bar chart and increments in
10ths.
Trend
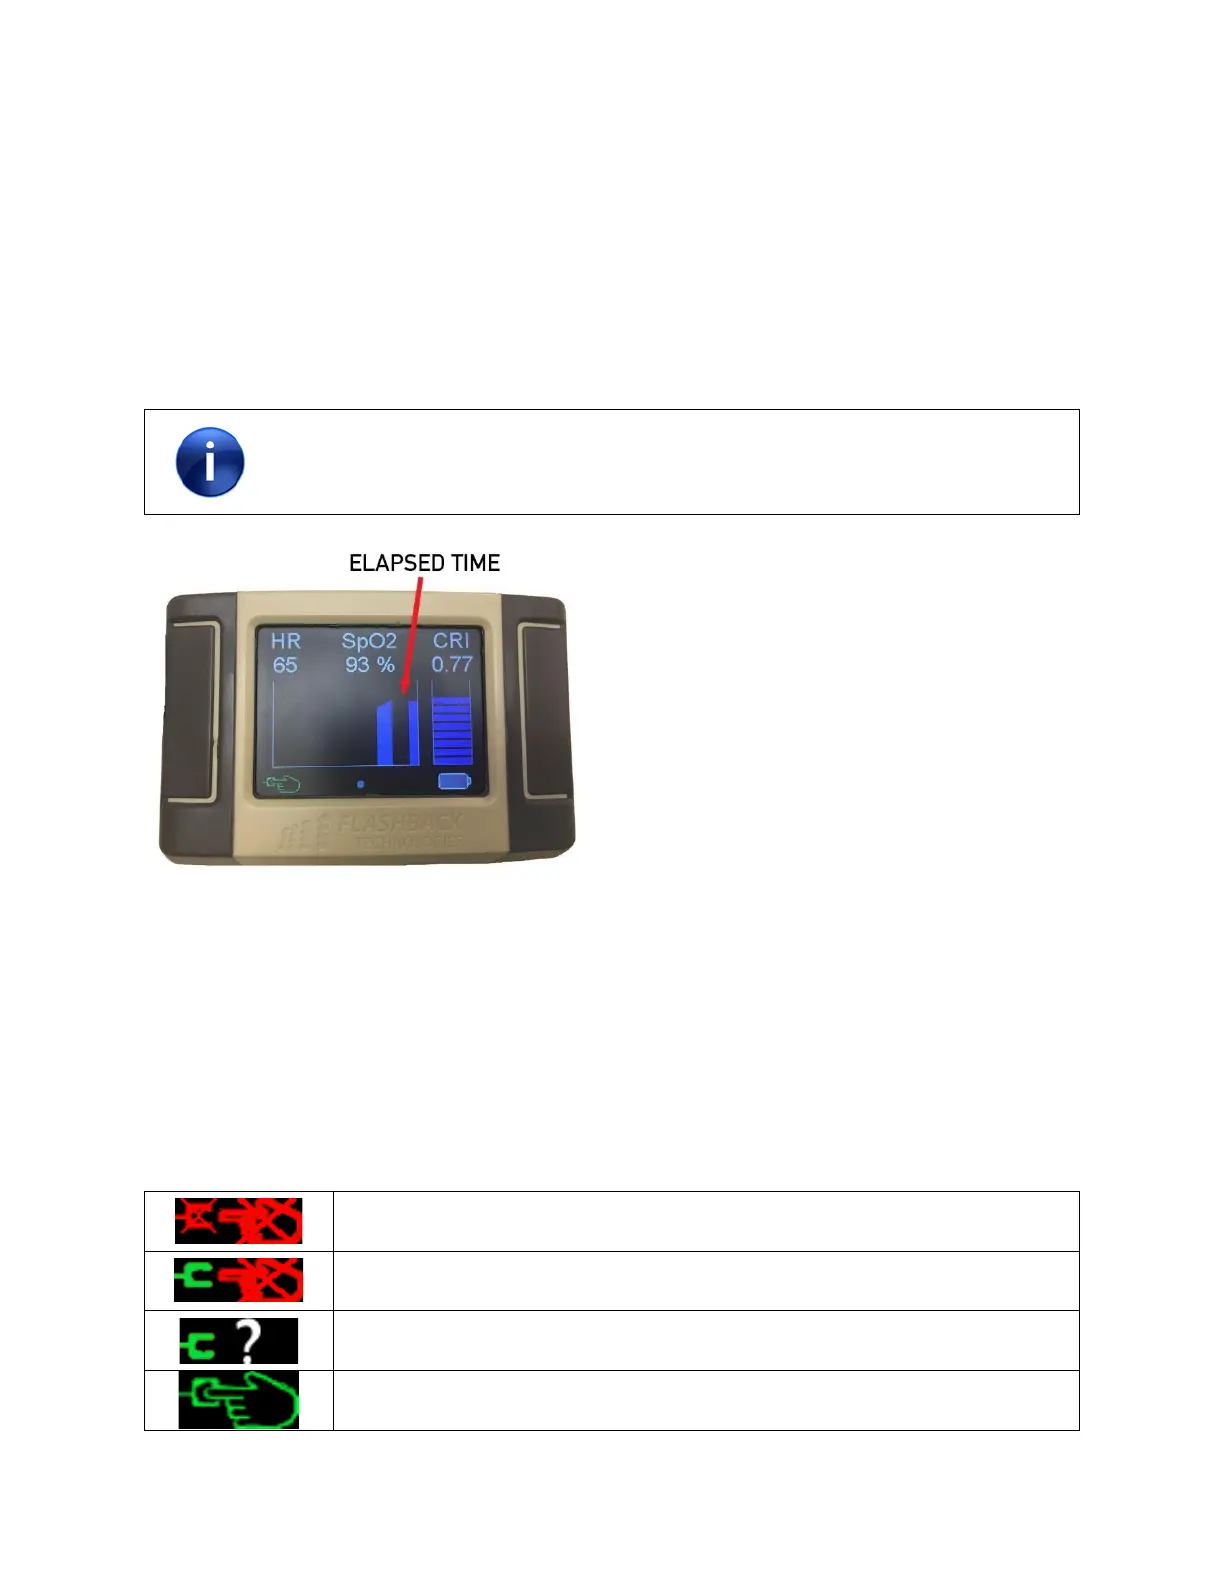
The “Trend” graph to the left of the screen displays up to 20 minutes of the most recent CRI trend values.
The trend value is updated every 5 seconds with the average CRI over the last minute. The trend moves
from left to right and therefore, the most recent average is on the right (see Figure 6).
If the sensor is not connected or there is no signal, the trend will continue to move,
leaving empty space in the graph, in order to indicate time has passed since data has
been collected.
Figure 6 - CRI trend
Sensor Status
The Sensor Status indicator displays the status of the:
• Sensor connection to the device
• Sensor connection to the finger
• Finger signal quality
There are four Sensor Status states:
Sensor not connected to the device or is not detected by device
Sensor connected/detected; no finger signal
Sensor connected/detected; poor finger signal
Sensor connected/detected; finger signal is satisfactory