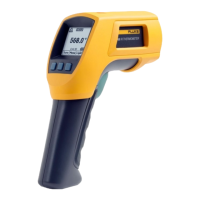
Visualize, systematically maintain and analyze temperature data using Windows
®
compatible software and a Fluke 574 or 574-NI IR thermometer.
Software for Condition Monitoring and
Process Control
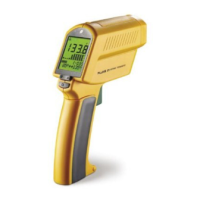
Graph
•
Visually review data and
spot trends instantly through
graphs
•
Simultaneously graph
results while continuously
monitoring temperatures
•
Quickly compare
temperatures of up to five
log locations for trends or
anomalies
•
Display infrared and/or probe
temperature trends over time
•
View infrared and probe
values continuously on
thermometer sidebar
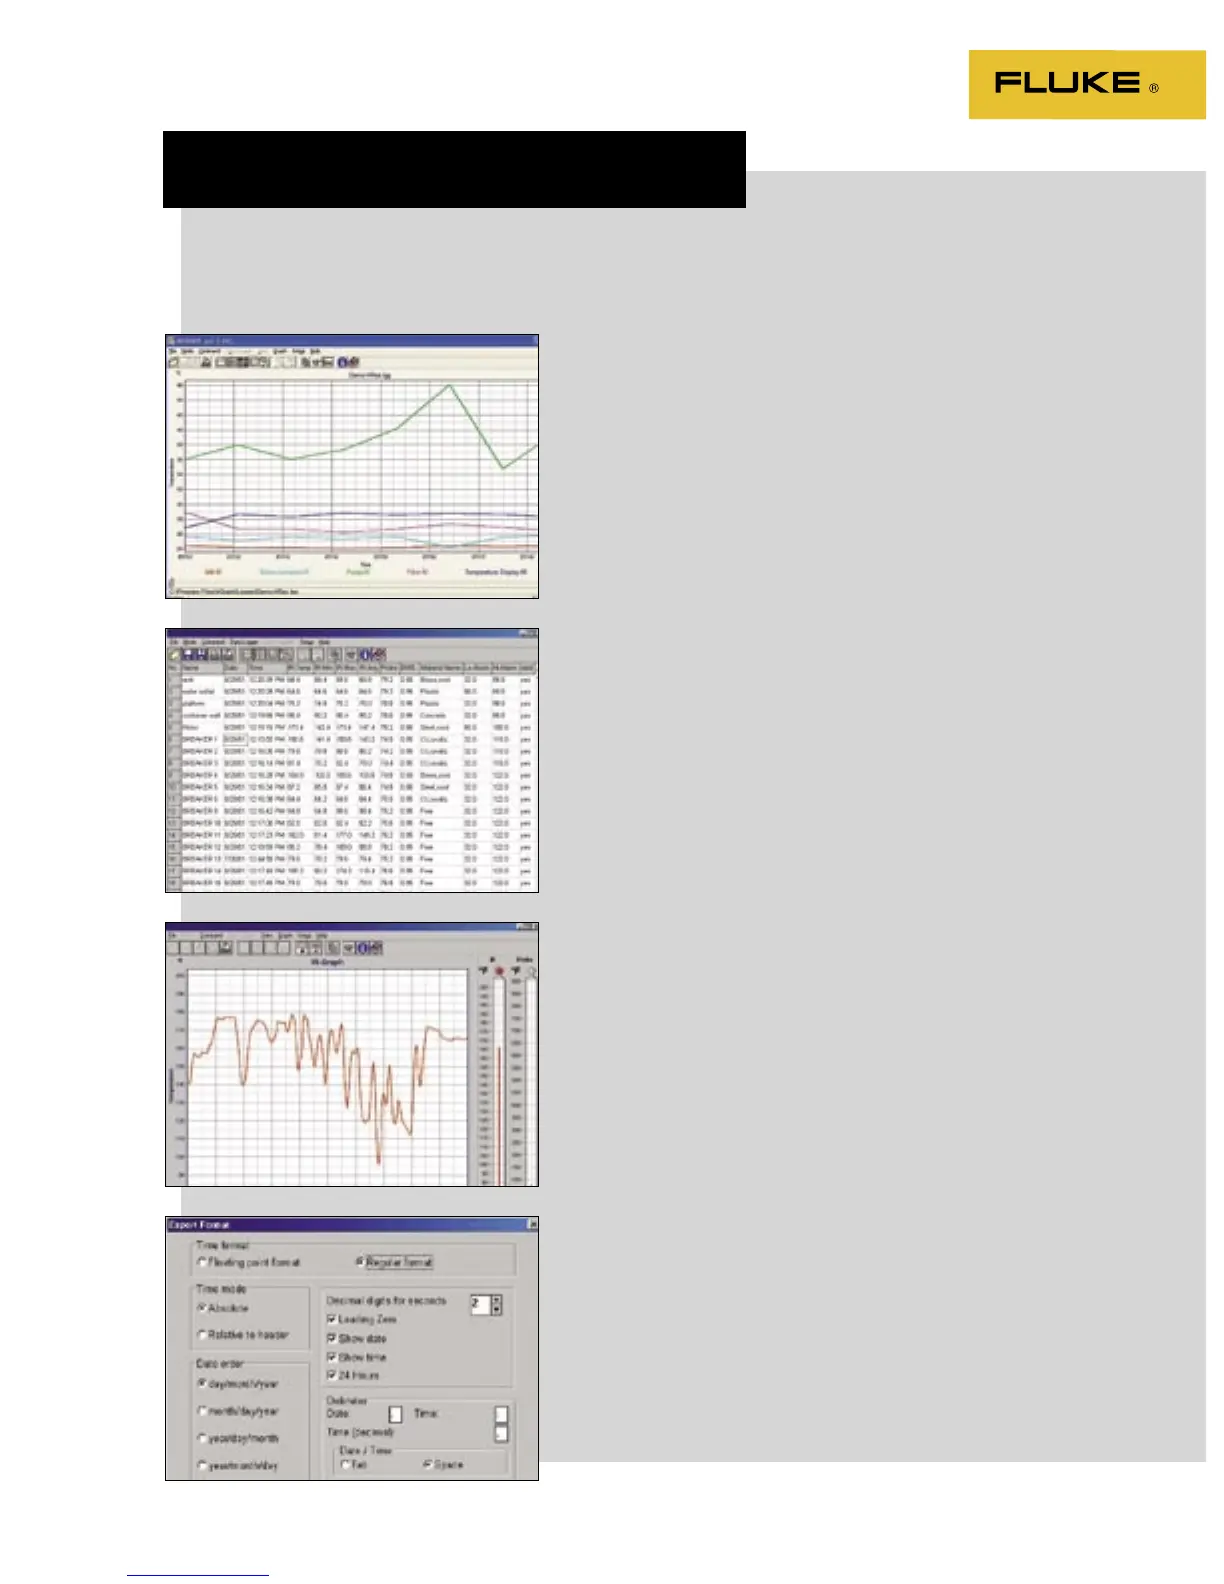
Data log
•
Create recognizable names
for inspection locations
•
Track both infrared and
probe temperature trends
•
Tailor high/low alarms per
individual inspection location
•
View min, max, and
average infrared and probe
temperatures
•
Create and customize
emissivity tables for each
inspection location
•
Store up to 10,000 data
points in a file
Reporting and
documentation
•
Customize report views and
printing formats
•
Generate time and date-
stamp printouts for accurate
records
•
Export data as text files
for integration with
Maintenance, Repair and
Operations (MRO) systems
and other database programs
Easily see
temperature trends
and potential
equipment problems
by graphing data
accumulated with
the unit’s data
logging feature.
The software
makes it easy
to error-proof
inspection routes
by giving names,
alarm points and
emissivities to
locations.
The 574 can be used
to monitor, graph,
and record real-time
temperature changes
with the software.
The software
provides a
convenient way to
export temperature
data files in a format
that can be used by
programs such as
Access
®
, Excel
®
, and
condition monitoring
programs.
 Loading...