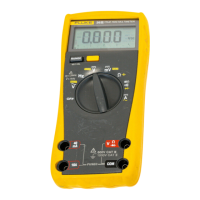
Digital
Display
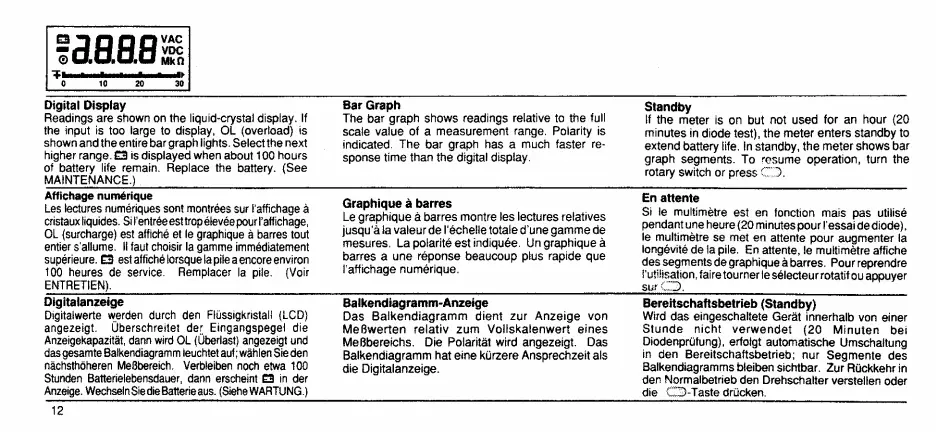
Readings
are shown
on
the liquid-crystal
display.
If
the
input
Is
too
large
to
display,
OL (overload)
is
shown
and the entire bar
graph lights.
Select
the next
higher
range.
£3
is
displayed
when
about 1 00
hours
of
battery
life remain. Replace the
battery.
(See
MAINTENANCE.)
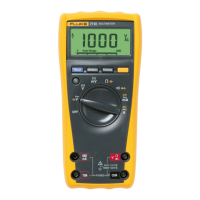
Bar
Graph
The
bar
graph shows readings
relative
to
the
full
scale
value
of
a
measurement
range.
Polarity
is
indicated.
The
bar
graph
has
a
much
faster
re*
sponse
time than the digital display.
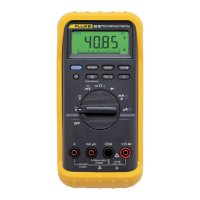
Standby
If
the
meter is on
but
not used
for
an
hour
{20
minutes
in
diode test), the
meter
enters standby
to
extend
battery life, in
standby,
the
meter shows
bar
graph
segments.
To
resume
operation,
turn the
rotary
switch
or
press
CD.
Affichage
num^rique
Les
lectures
numeriques
sont
montrees
sur
Taffichage
a
chstaux
liquides. Si
rentr^esttropeleveepourl’aftichage,
OL
(surcharge) est affiche
et le
graphique
a barres tout
entier s'allume.
II
faut
choisir
la
gamme
immediatement
superieure.
E3
est
affiche lorsque la pile
a encore
environ
too
heures
de
service.
Remplacer
la pile.
(Voir
ENTRETIEN).
Graphique a barres
Le graphique
a
barres montre
les lectures
relatives
jusqu’a
la
vateur
de
I'echelie
totale d’une
gamme
de
mesures.
La polarite est
indiquee. Un
graphique
a
barres
a
une
reponse
beaucoup
plus rapide
que
I’affichage
numerique.
En
attente
Si
!e multimetre
est en
tonction
mats pas
utilise
pendant
une
heure
(20
minutes
pour
I’essai
de
diode)
,
le multi
metre
se
met
en
attente
pour
augmenter la
longevite
de la
pile.
En
attente,
!e
multimetre
affiche
des segments
de
graphique
a
barres.
Pour reprendre
i'utiiisation,
faire
tourner
le
selecteur rotatif
ou
appuyer
sur
CD,
Digitalanzeige
Digitaiwerte
werden
durch den
Flussigkristali (LCD)
angezeigt.
Oberschreitet der
Eingangspegei
die
Anzeigekapazitat,
dann
wird OL (Oberlast)
angezeigt
und
das
gesamte
Balkendiagramm
leuchtet
auf
:
wahlen Sie den
nachsthdheren MeSbereich. Verbteiben
noch
etwa
100
Stunden Batterielebensdauer, dann
erscheint
£3
in
der
Anzeige. Wechsein
Sie
die
Batterie
aus.
(Siehe
WARTUNG
.)
Balkendiagramm-Anzeige
Das
Balkendiagramm
dient
zur
Anzeige
von
MeOwerten
relativ zum
Vollskalenwert eines
MeObereichs.
Die Polaritat wird angezeigt. Das
Balkendiagramm hat eine kurzere Ansprechzeit als
die
Digitalanzeige.
Bereitschaftsbetrieb
(Standby)
Wird
das
eingeschaltete
Gerat
innerhalb
von
einer
Stunde nicht
verwendet
(20
Mlnuten
bei
Diodenprutung),
erfotgt
automatische
Umschaftung
in
den
Bereitschaftsbetrieb:
nur
Segmente
des
Balkendiagramms
bleiben
sichtbar.
Zur
Ruckkehr in
den
Normalbetrieb
den
Drehschalter
verstellen
oder
die CD-Taste drCicken.
12

 Loading...