103
g
CO2 reduction
CO2 emissions saved during the monitored period
(kg / T; T = tons)
The area for unit display switches between ‘kg’ or ‘T’ and ‘CO2.’
The CO2 meter gives an indication of CO2 emissions that would be released during the
generation of the same amount of electricity in a combustion power plant.
The factory setting is 0.59 kg / kWh (source: DGS - the German Society for Solar Energy).
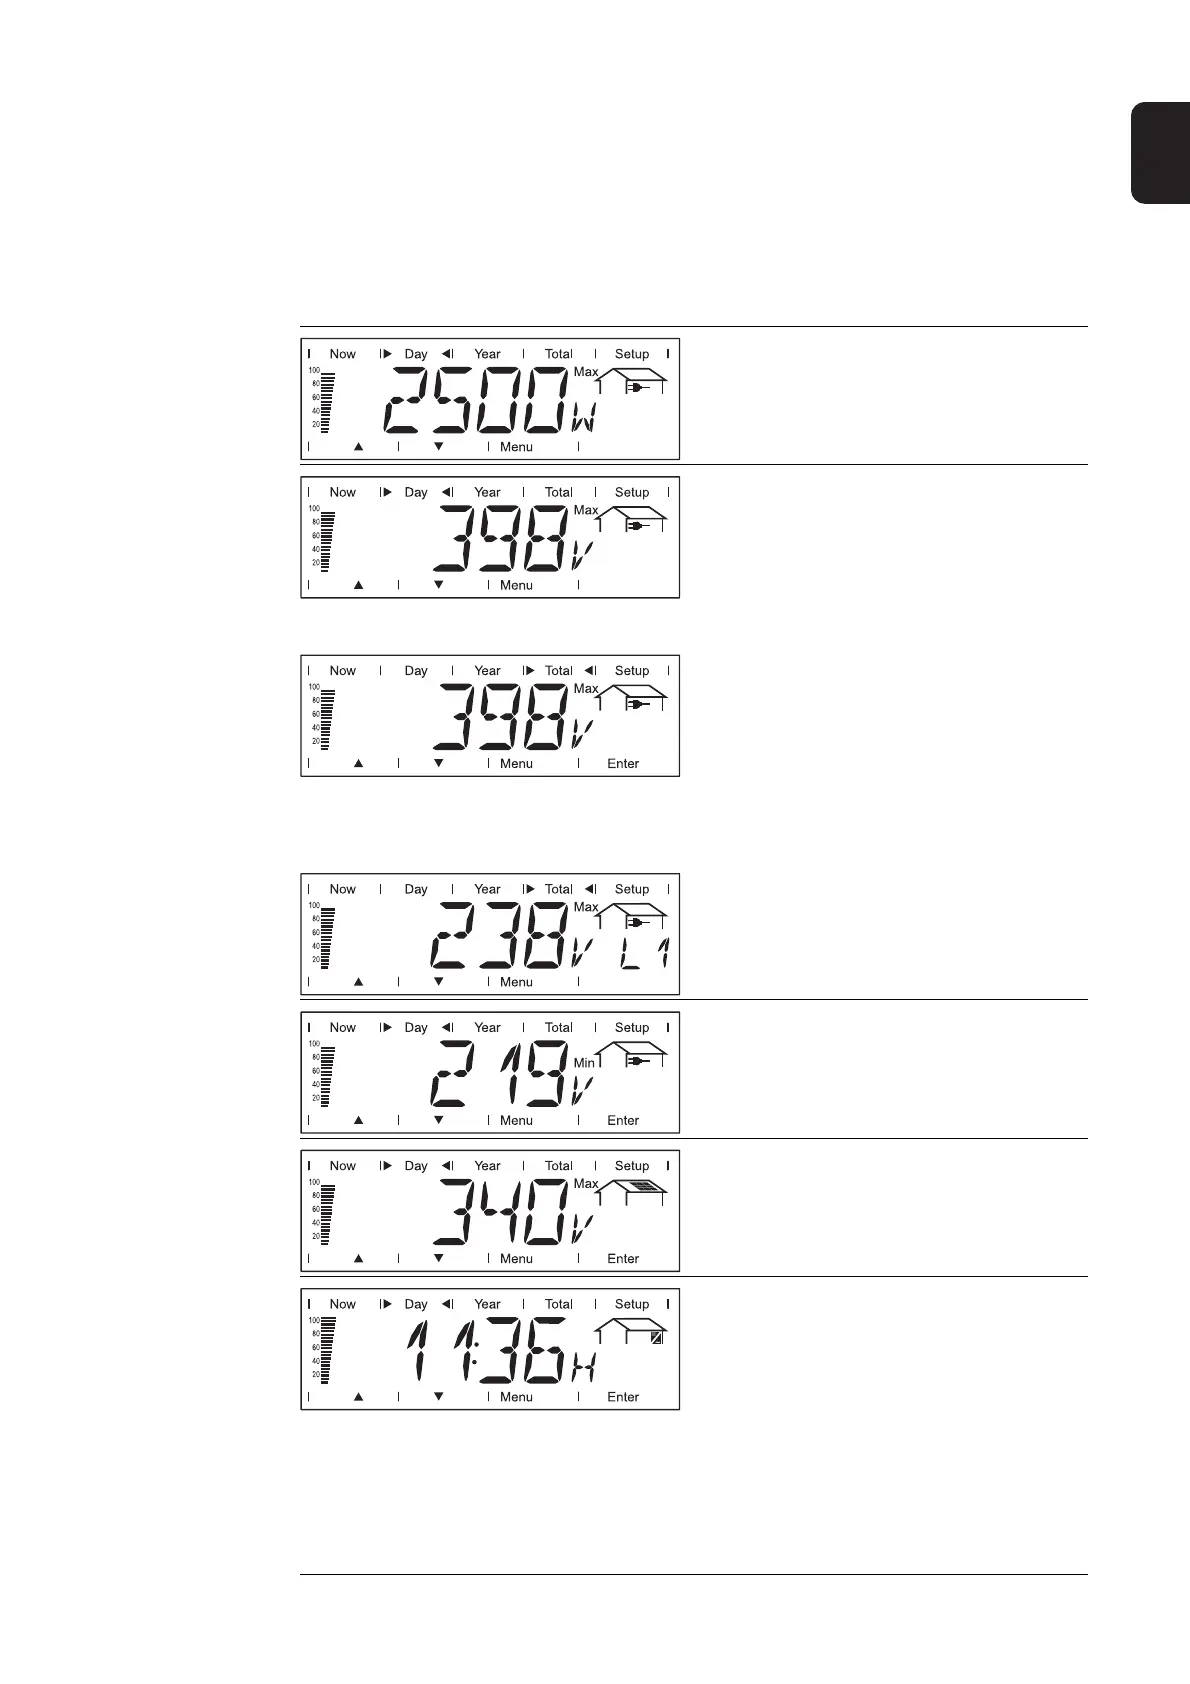
Maximum output power
Highest output power of the inverter dur-
ing observation period (watts)
Maximum grid voltage
Highest reading of grid voltage (V) during
observation period
For example, maximum phase voltage for
phase L1:
The 'Enter' key is active in the 'Total' dis-
play mode depending on the country set-
up or the device-specific settings.
- The maximum phase voltage mea-
sured during the time in question can
be displayed by pressing the 'Enter'
key.
- The maximum phase voltage of the
other phases measured during the
time in question can be displayed by
pressing the 'Up' and 'Down' keys.
- You can return to the menu level by
pressing the 'Menu' key.
Minimum grid voltage
Lowest reading of grid voltage (V) during
observation period
Maximum solar module voltage
Highest reading of solar module voltage
(V) during observation period
Operating hours
Indicates how long the inverter has been
operating
(HH:MM)
Duration of operation is shown in hours and minutes up to 999 h and 59 min (display:
‘999:59’). After that only full hours are displayed.
Although the inverter does not operate during the night, all sensor data are recorded
around the clock.