learn about your cycling performance.
1 Ride at a steady, high intensity for at least 20
minutes.
2 After your ride, select Save.
3 Select to scroll through the performance
measurements.
Viewing Your Predicted Race Times
For the most accurate estimate, complete the user
profile
setup (Setting Up Your User Profile, page 26), and set your
maximum heart rate (Setting Your Heart
Rate Zones, page
27).
Your device uses the VO2 max. estimate (About VO2 Max.
Estimates, page 20) and your training history to provide a
target race time. The device analyzes several weeks of your
training data to refine the race time estimates.
TIP: If you have more than one Garmin device, you can
enable the Physio TrueUp™ feature, which allows your
device to sync activities, history, and data from
other
devices (Syncing Activities and Performance
Measurements,
page 20).
1 From the watch face, select UP or DOWN to view the
performance widget.
2 Select to scroll through the performance
measurements.
Your projected race times appear for 5K, 10K, half
marathon, and marathon distances.
NOTE: The projections may seem inaccurate at first.
The device requires a few runs to learn about your
running performance.
About Training Effect
Training Effect measures the impact of an activity on your
aerobic and anaerobic fitness. Training Effect accumulates
during the activity. As the activity progresses, the Training
Effect value increases.
Training Effect is determined by your user profile
information and training history, and heart rate, duration, and
intensity of your activity. There are seven different Training
Effect labels to describe the primary benefit of your activity.
Each label is color coded and corresponds to your training
load focus (Training Load Focus, page 24). Each feedback
phrase, for example, “Highly Impacting VO2 Max.” has a
corresponding description in your Garmin Connect activity
details.
Aerobic Training Effect uses your heart rate to measure how
the accumulated intensity of an exercise affects your aerobic
fitness and indicates if the workout had a maintaining or
improving effect on
your fitness level. Your excess post-exercise oxygen
consumption (EPOC) accumulated during exercise is
mapped to a range of values that account for your fitness
level and training habits. Steady workouts at
moderate effort or workouts involving longer intervals (>180
sec) have a positive impact on your aerobic metabolism and
result in an improved aerobic Training
Effect.
Anaerobic Training Effect uses heart rate and speed (or
power) to determine how a workout affects your ability to
perform at very high intensity. You receive a value based
on the anaerobic contribution to EPOC and the type of
activity. Repeated high- intensity
intervals of 10 to 120 seconds have a highly beneficial impact
on your anaerobic capability and result in an improved
anaerobic Training Effect.
You can add Aerobic Training Effect and Anaerobic
Training Effect as data fields to one of your training
screens to monitor your numbers throughout the activity.
Training Effect technology is provided and supported by
Firstbeat Technologies Ltd. For more information, go to
www.firstbeat.com.
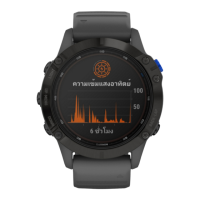
Heart Rate Variability and Stress Level
Stress level is the result of a three-minute test
performed
while standing still, where the fe nix device
analyzes heart rate
variability to determine your overall stress. Training, sleep,
nutrition, and general life stress all impact how a runner
performs. The stress level range is from 1 to 100, where 1 is
a very low stress state and 100 is a very high stress state.
Knowing your stress level can help you decide if your body is
ready for a tough training run or yoga.
Viewing Your Heart Rate Variability and Stress Level
This feature requires a Garmin chest heart rate monitor.
Before you can view your heart rate variability (HRV) stress
level, you must put on a heart rate monitor and pair it with
your device (Pairing Your Wireless Sensors, page 47).
TIP: Garmin recommends that you measure your stress
level at approximately the same time and under the same
conditions every day.
1 If necessary, select > Add > HRV Stress to add the
stress app to the apps list.
 Loading...