gpelectric.com | [page 9]
INTRODUCTION
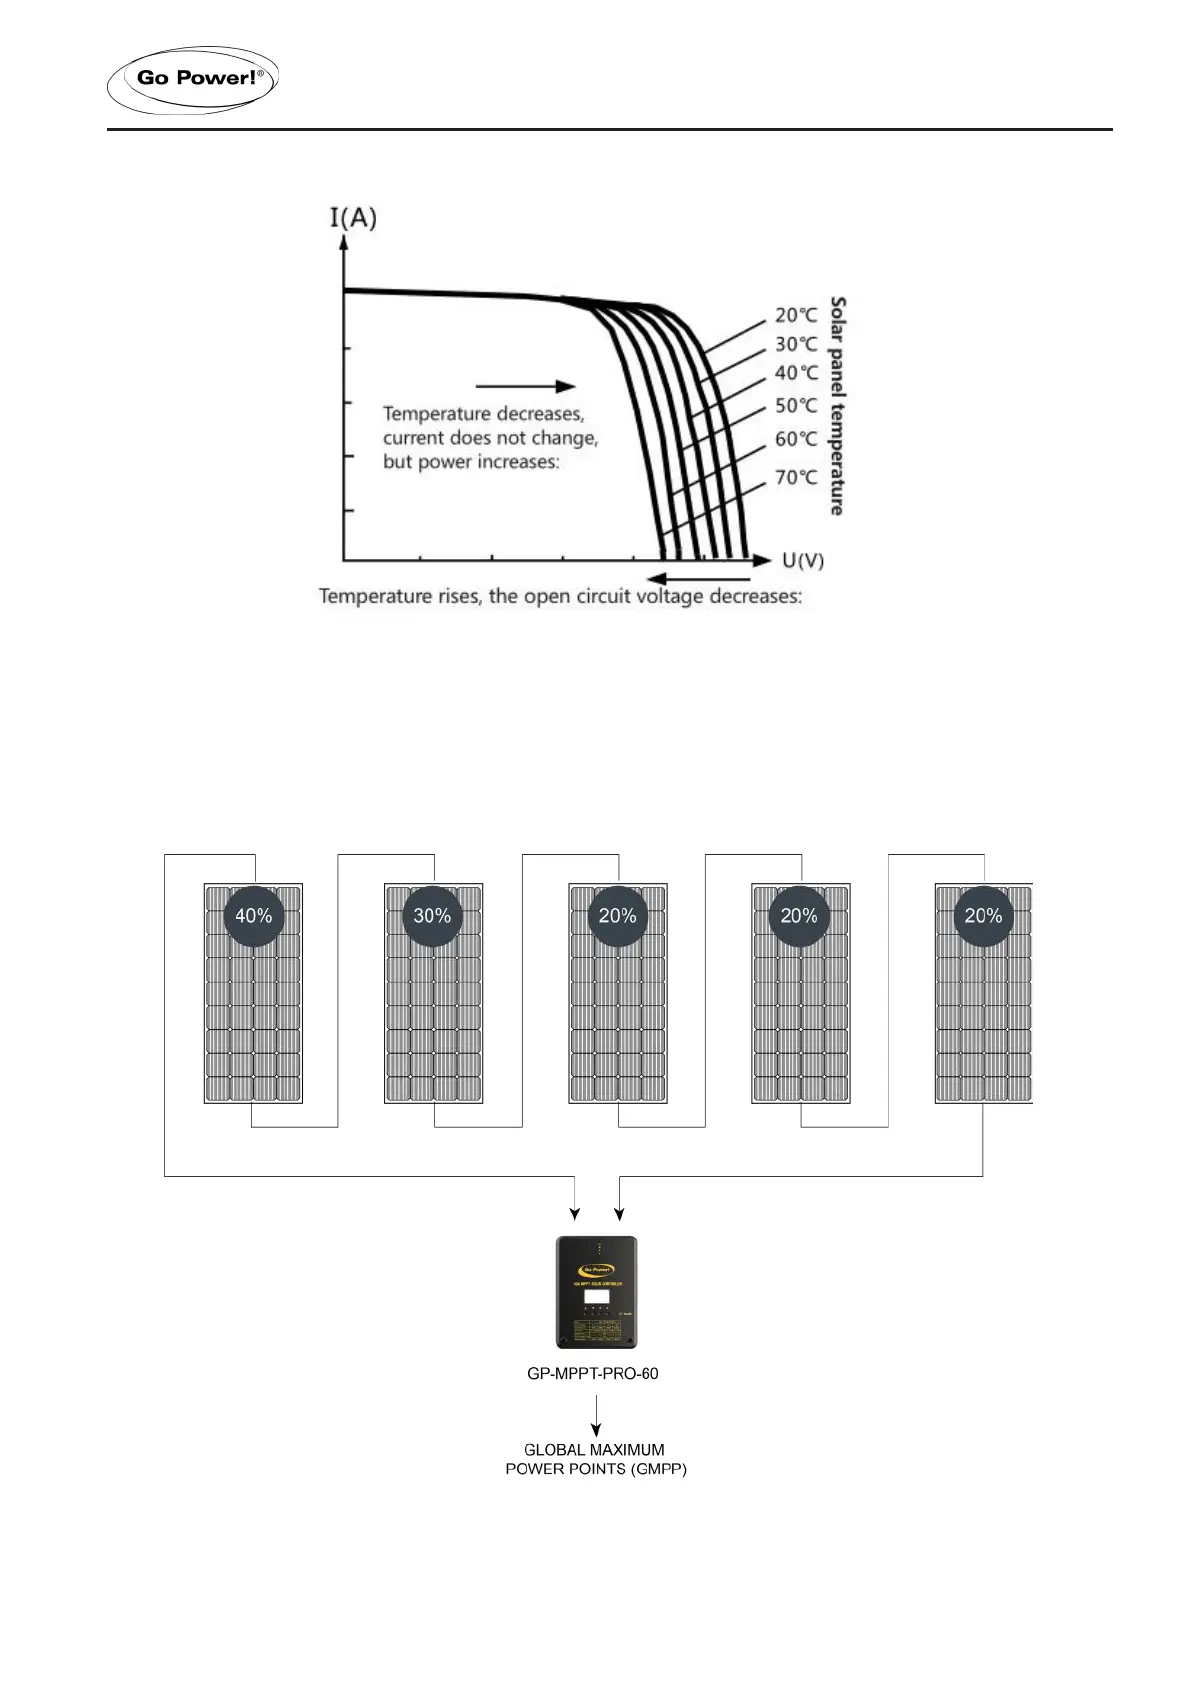
In partially shaded conditions there can also be multiple peaks in the P-V curve that can confuse an MPPT algorithm.
Shown in Figure 1-5 is a series string of solar panels and a corresponding graph that shows lower maximum power points
(LMPP) and the greater maxim power point (GMPP) that will result in maximum energy transfer. The GP-MPPT-PRO
series has a smart algorithm that will always choose the right peak.
FIGURE 1-4 Relationship between solar panel output characteristics and temperature
(A)
 Loading...