Performance and ceves diagrams
49 Domestic air conditioner
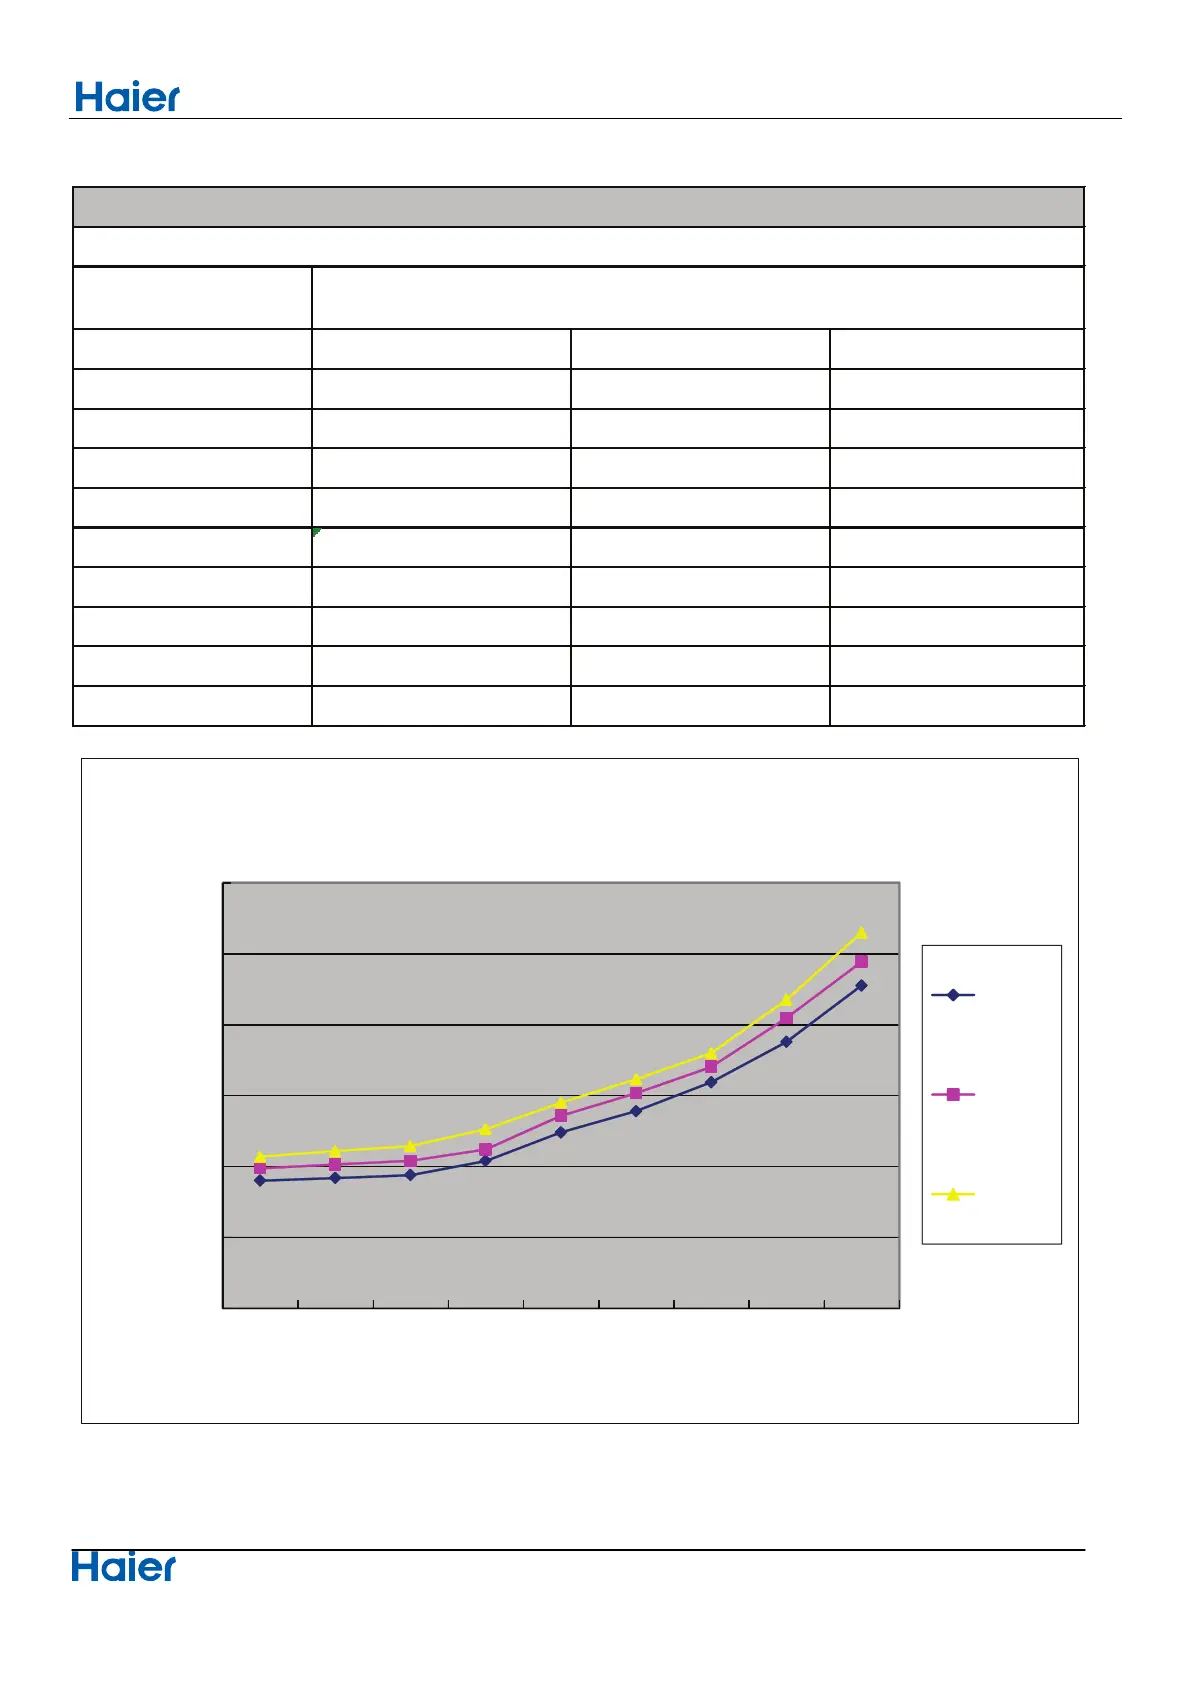
11.3 Cooling discharge pressure curves
performance curves
cooling discharge pressure.table
outdoor temp.
(humidity 46%)
indoor temp.
DB/WB 21/15℃ 27/19℃ 35/24℃
10℃
1899 1986 2068
15℃
1917 2012 2108
20℃
1938 2039 2144
25℃
2038 2118 2261
30℃
2239 2357 2450
35℃
2389 2516 2614
38℃
2593 2701 2799
40℃
2877 3045 3174
43℃
3275 3442 3649
cooling discharge pressure and temp. curves
4000
3500
21/15℃
3000
2500
27/19℃
2000
35/24℃
1500
1000
10℃ 15℃ 20℃ 25℃ 30℃ 35℃ 38℃ 40℃ 43℃
outdoor temp.(DB/WB)
discharge pressure (Kpa)
 Loading...