DS-72xxHUI-Kx, DS-72xxHQI-Kx Digital Video Recorder (DVR) User Manual
UM DS-72xxHUI-Kx, DS-72xxHQI-Kx 062817NA 137
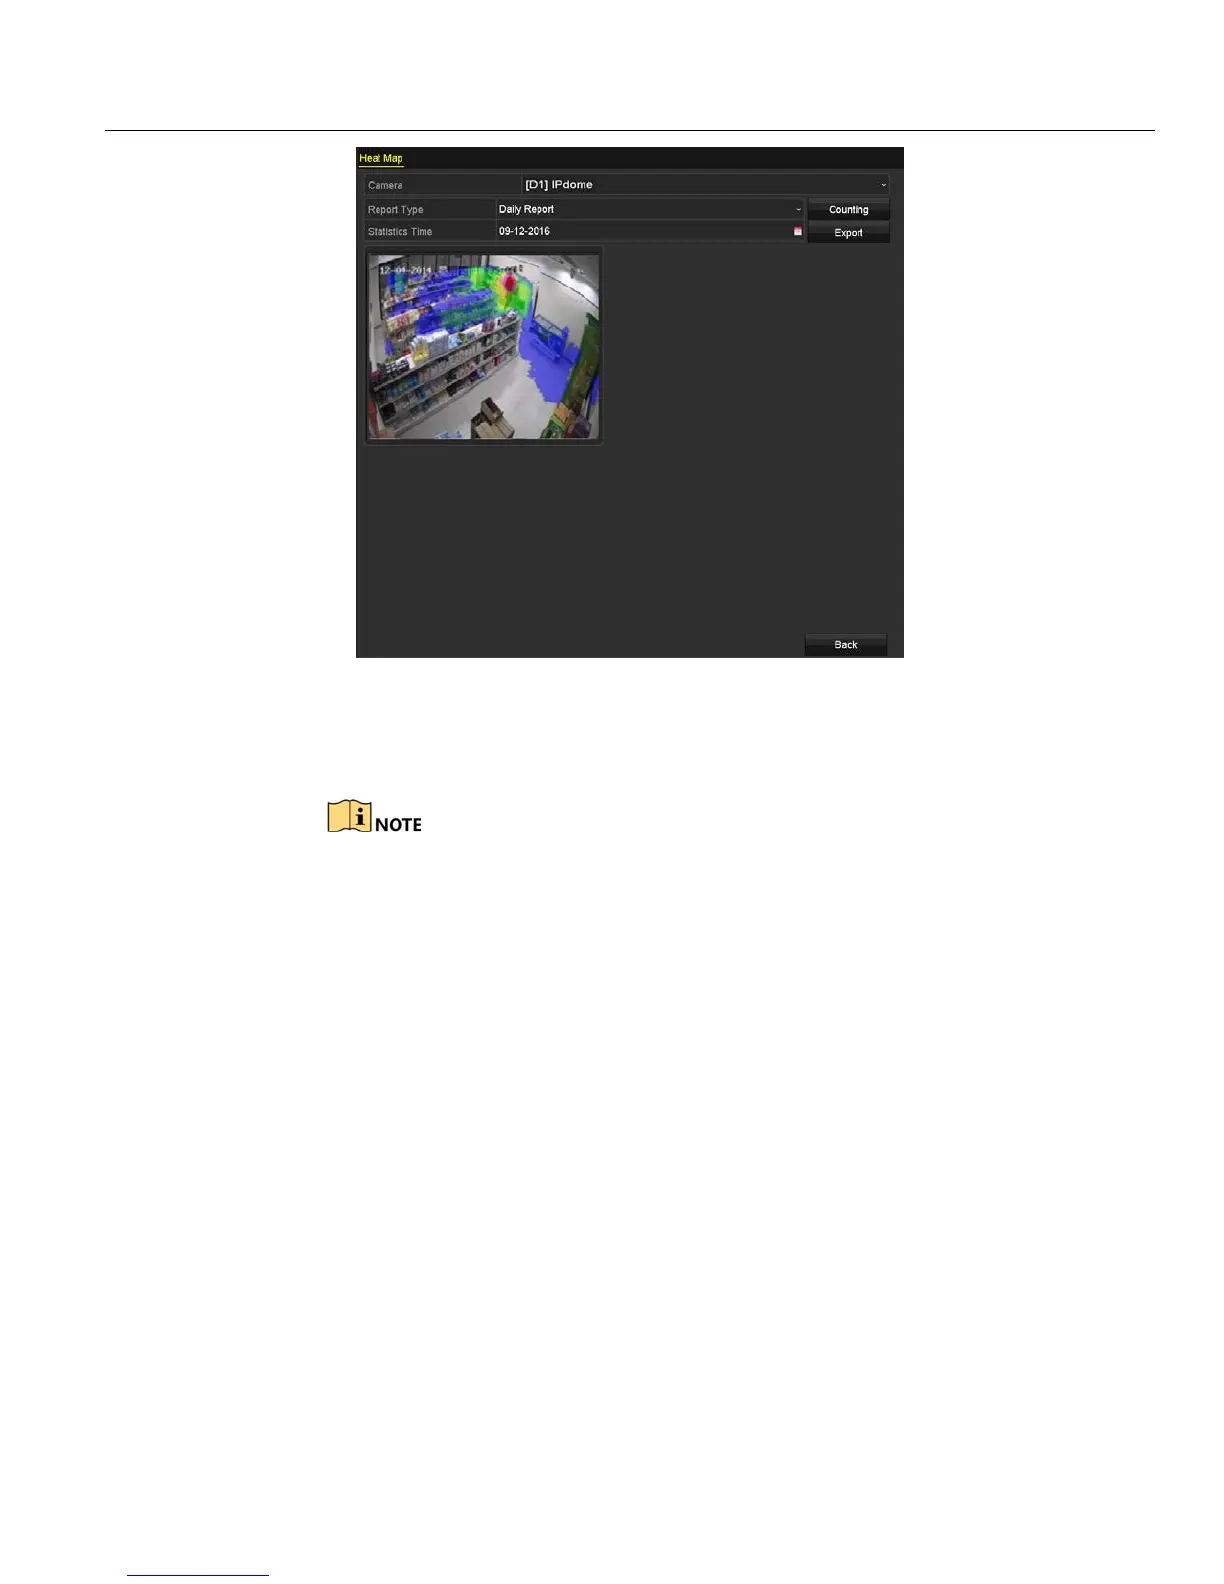
Figure 170, Heat Map Interface
5. Click Counting to export the report data and start heat map statistics. The results are displayed in graphics
marked in different colors.
As shown in Figure 10-8, red color block (255, 0, 0) indicates the
most popular area, and blue color block (0, 0, 255) indicates the
less-popular area.
6. You can click E
xport to export the statistics report in Microsoft Excel format.
 Loading...