99
Statistics
Curve Fitting
Exponential Curve Fit
Using the
function of the HP-12C, a least squares exponential curve
fit may be easily calculated according to the equation y=Ae
Bx
. The
exponential curve fitting technique is often used to determine the growth
rate of a variable such as a stock's value over time, when it is suspected
that the performance is non-linear. The value for B is the decimal value of
the continuous growth rate. For instance, assume after keying in several
end-of-month price quotes for a particular stock it is determined that the
value of B is 0.10. This means that over the measured growth period the
stock has experienced a 10% continuous growth rate.
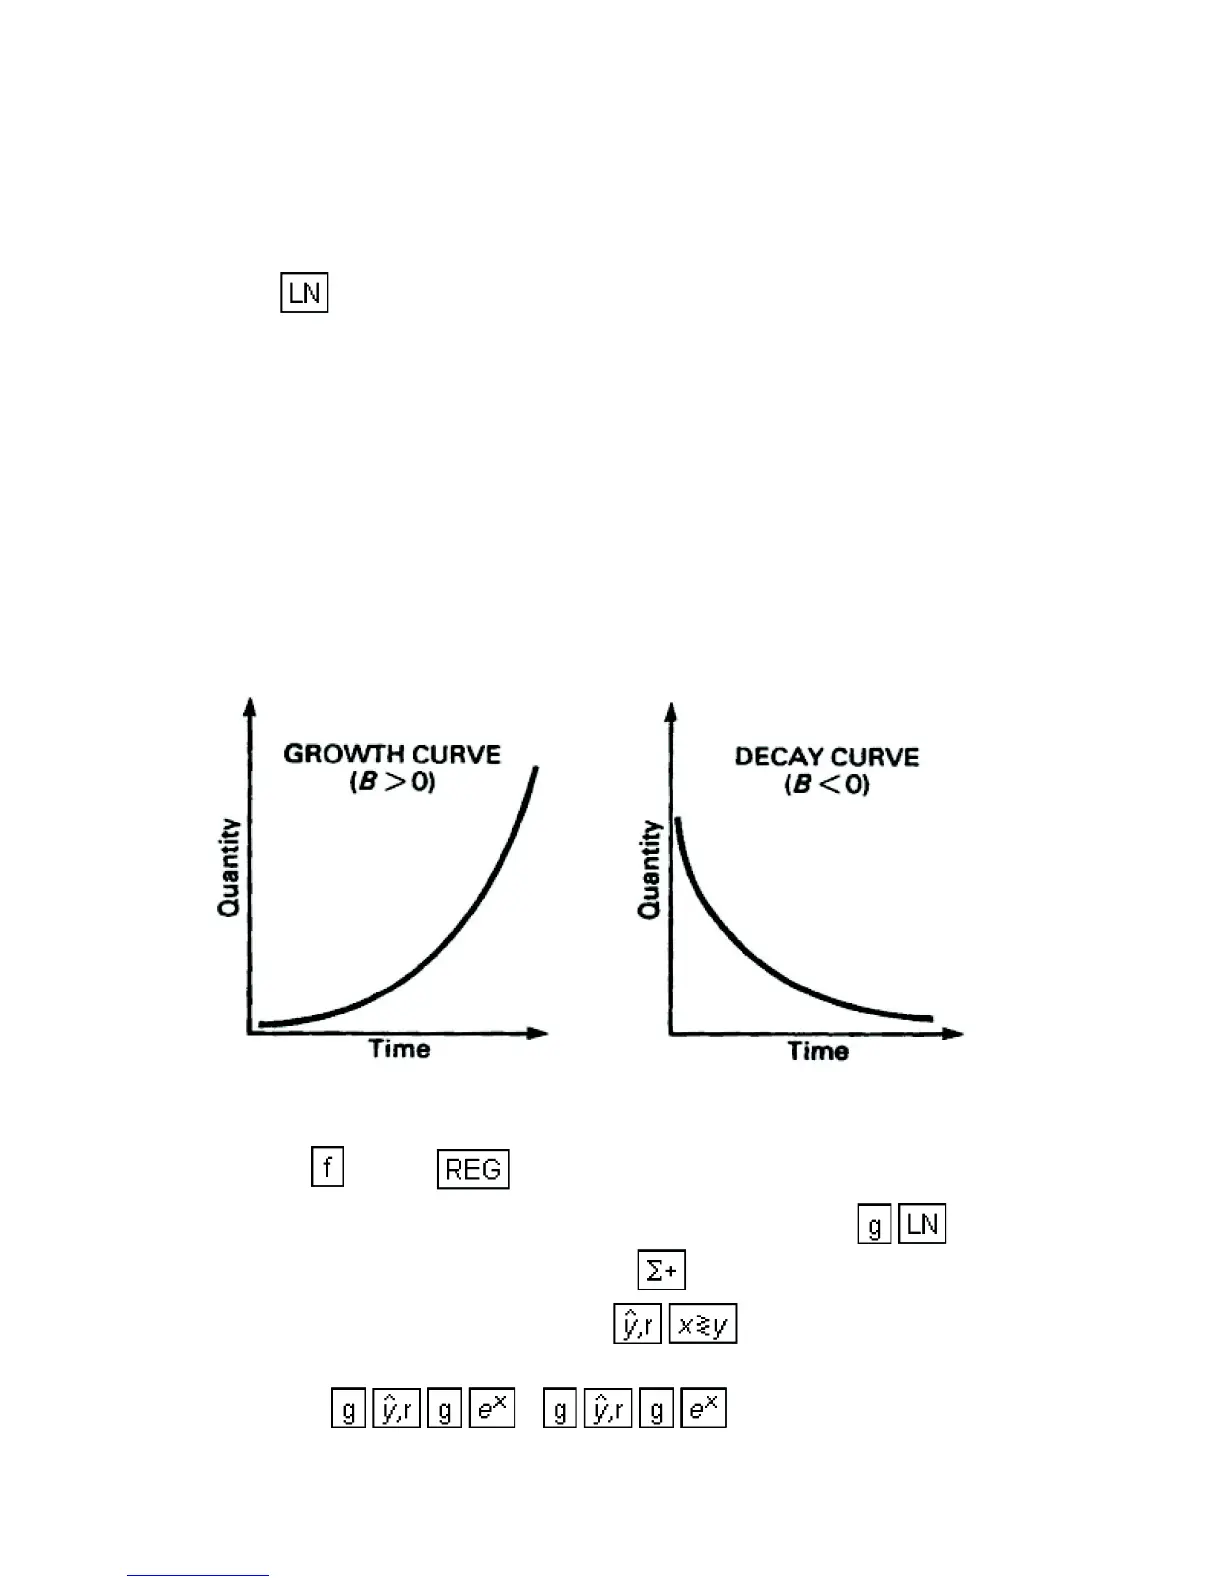
If B>0, you will have a growth curve. If B
Examples of these are given below.
The procedure is as follows:
1. Press CLEAR .
2. For each input pair of values, key in the y-value and press , key in
the corresponding x-value and press .
3. After all data pairs are input, press to obtain the correlation
coefficient (between ln y and x).
4. Press 1 0 to obtain A in the equation
above.

 Loading...