Aplets and their views 2-21
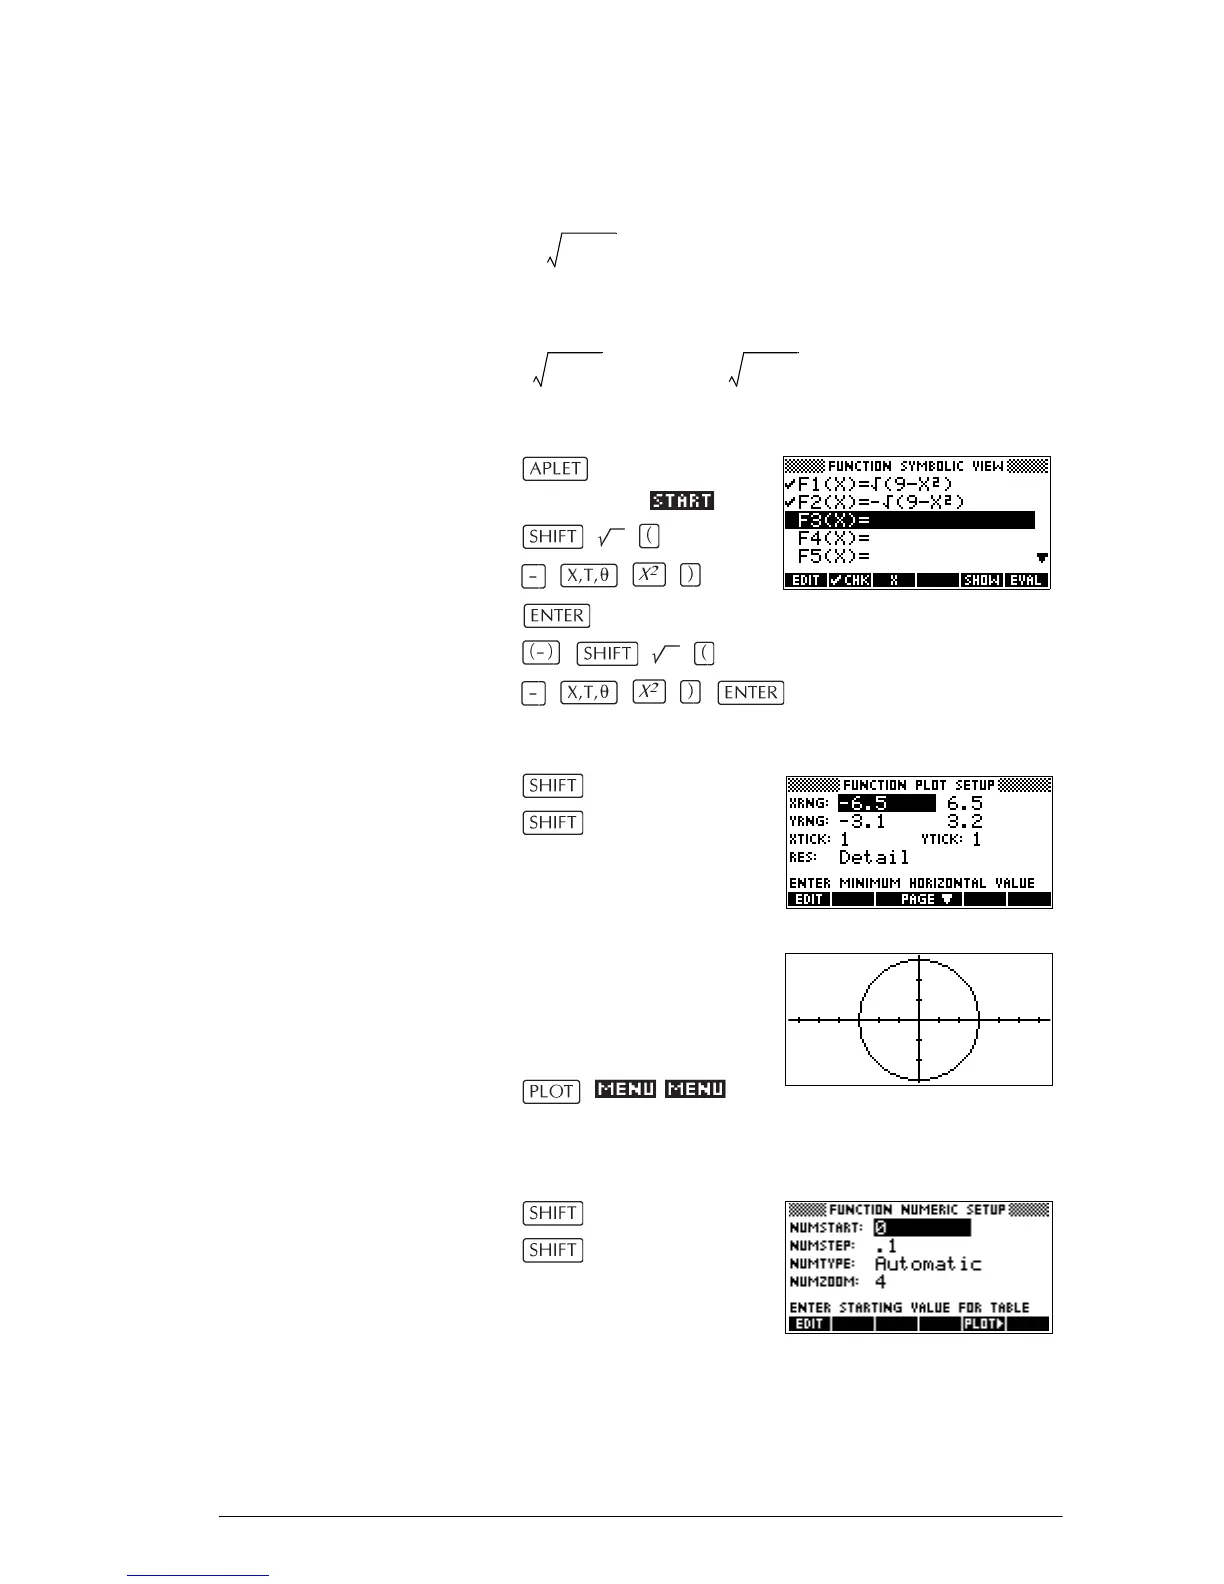
Example: plotting a circle
Plot the circle, x
2
+ y
2
= 9. First rearrange it to read
.
To plot both the positive and negative y values, you need
to define two equations as follows:
and
1. In the Function aplet, specify the functions.
Select
Function
9
9
2. Reset the graph setup to the default settings.
SETUP-PLOT
CLEAR
3. Plot the two functions
and hide the menu so
that you can see all the
circle.
4. Reset the numeric setup to the default settings.
SETUP-NUM
CLEAR
y 9 x
2
–±=
y 9 x
2
–= y 9 x
2
––=