A
Theory of Operation
Spectrum Analyzer
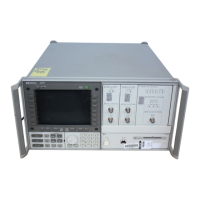
The HP 70000 Series modular spectrum analyzer systems are superheterodyne receivers, which
are electronically tuned by applying an adjustable saw-tooth voltage ramp to a voltage-tuned
local oscillator (LO). The input signal is mixed with a signal from the LO, the output of the
mixer is amplied, ltered, detected, and then converted to digital values which are stored in
the spectrum analyzer.
Stored measurement results can be retrieved several ways. If the spectrum analyzer is
connected to a display (for example, HP 70004A color display, HP 70205A graphics display or
HP 70206A system graphics display), measurement results can be displayed. Measurement
results can also be monitored with a computer. Figure A-1 illustrates the basic spectrum
analyzer functions.
Figure
A
-1.
Simplied
Spectrum
Analyzer
Block
Diagram
F
or
an
input signal, F
S
,
the
LO
frequency is tuned so that
F
LO
0
F
S
=F
IF
where
F
LO
is the local oscillator frequency
F
S
is the tuning frequency (displayed response)
F
IF
is the mixing product
When this equation is satised, the input signal can be detected.
When the full voltage range of the sweep ramp is applied to the local oscillator, it sweeps
through its frequency range, yielding a wide range of frequencies at the mixer output.
However, since the intermediate-frequency (IF) amplier passes only frequencies within its
passband, measured spectrum for a continuous-wave signal is simply a plot of the passband of
the resolution bandwidth lters in the IF amplier.
Theory of Operation A-1

 Loading...