Model8555A
8 Adjust INTENSITY for a display trac'e.
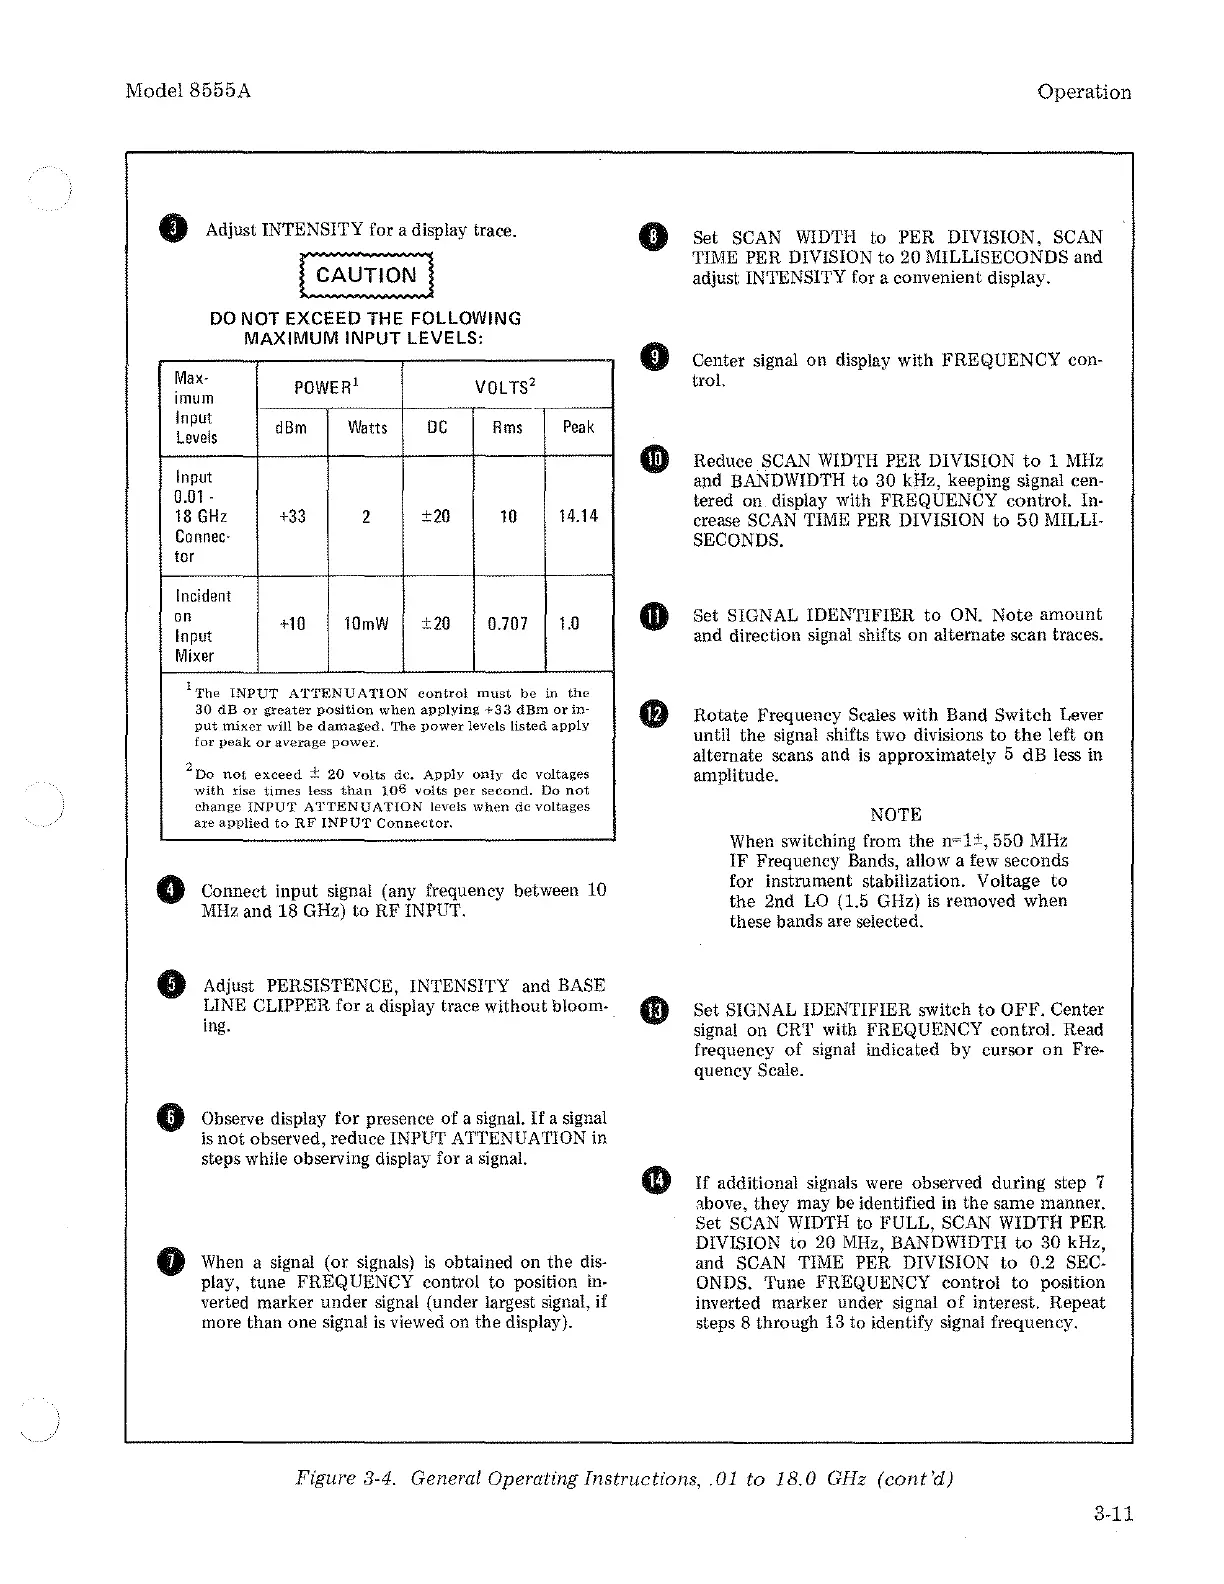
DO
NOT EXCEED THE FOLLOWING
MAXIMUM
INPUT LEVELS:
Max-
POWER
1
VOL
TS
2
imum
Input
dBm
Watts
DC
Rms
Peak
Levels
Input
0.01
.
18
GHz
+33
2
±20
10
14.14
Con
nee-
tor
Incident
on
Input
+10
10mW
±20
0.707
1.0
Mixer
1
The
INPUT
ATTENUATION
control
must
be
in
the
30
dB
or
greater
position
when
applying
+33
dBm
or
in-
put
mixer
will
be
damaged.
The
power
levels
listed
apply
for
peak
or
average
power.
2
Do
not
exceed
±
20
volts
de.
Apply
only
de
voltages
0
•
•
0
with
rise
times
less
than
106
volts
per
second.
Do
not
change
INPUT
AT1'ENUATION
levels
when
de
voltages
are
applied
to
RF
INPUT
Connector.
Connect input signal (any frequency between 10
MHz
and 18 GHz)
to
RF INPUT.
Adjust PERSISTENCE, INTENSITY and
BASE
LINE CLIPPER for a display trace without bloom-
ing.
·
Observe display for presence
of
a signal.
If
a signal
is
not
observed, reduce INPUT ATTENUATION in
steps while observing display for a signal.
When
a signal
(or
signals)
is
obtained on the dis·
play, tune FREQUENCY control to position
in-
verted marker under signal (under largest signal, if
more than one signal
is
viewed on
the
display).
•
Operation
Set SCAN
WIDTH
to PER DIVISION. SCAN
TIME PER DIVISION
to
20 MILLISECONDS and
adjust
INTENSITY for a convenient display.
0 Center signal on display with FREQUENCY con-
trol.
Reduce
SCAN
WIDTH
PER DIVISION
to
1
MHz
and BANDWIDTH to 30 kHz, keeping signal cen-
tered on display with FREQUENCY control. In·
crease
SCAN
TIME PER DIVISION
to
50
MILLI·
SECONDS.
Set SIGNAL
IDENTIFIER
to
ON.
Note
amount
and direction signal shifts on alternate scan traces.
Rotate Frequency
Scales with Band Switch Lever
until
the
signal shifts two divisions
to
the
left on
alternate scans and
is
approximately 5 dB less in
amplitude.
NOTE
When switching from the
n~1±,
550
MHz
IF
Frequency Bands, allow a few seconds
for instrument stabilization. Voltage
to
the
2nd
LO
(1.5 GHz)
is
removed when
these bands are selected .
Set SIGNAL IDENTIFIER switch
to
OFF.
Center
signal on
CRT with FREQUENCY control. Read
frequency
of
signal indicated
by
cursor
on
Fre*
quency Scale .
If
additional signals were observed during step 7
above, they may be identified
in
the same manner.
Set SCAN
WIDTH
to FULL, SCAN WIDTH PER
DIVISION
to
20
MHz,
BANDWIDTH
to
30 kHz,
and
SCAN TIME PER DIVISION
to
0.2 SEC-
ONDS.
Tune FREQUENCY control
to
position
inverted marker under signal
of
interest. Repeat
steps 8 through 13 to identify signal frequency.
Figure 3·4. General Operating Instructions, .01 to 18.0 GHz
(cont'd)
3-11