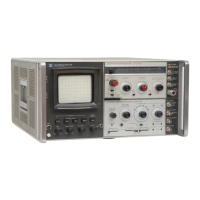
Model8555A
Set SCAN
WIDTH
to
FULL
and tune FRE-
QUENCY to place marker
under
any signal
on
the
display. Disregard
DISPLAY UNCAL light
at
this
time. Repeat step 22 for selected signal.
Change BAND Switch Lever until
the
correct
display is obtained. Read frequency
of
signal on
Frequency
Scale.
The signal
at
the -4.2 graticule line (just above the
analyzer's noise level) is
the
9 GHz signal from the
n~5-
harmonic. Signal shifts
to
the left approxi-
mately l and 2/3-divisions
on
n=4- Frequency
Band.
Figure 3-5b
Operation
Signals shown in Figure 3-5b (mixer overdriven)
are as follows:
Graticule
Harmonic
Frequency
Line Scale
-4.4
n
~
3-
4.5 GHz
-4.2
n
~
5-
See step 26
-3.0
n = 1+
4.5 GHz
-2.6
n
~
2-
3.0 GHz
-1.8
n
~
3-
6.0 GHz
-1.6
n
~
2+
7.5 GHz
-1.4
n
~
4-
9.0 GHz
+0.6
n~
3-
7.5 GHz
+1.0
n
~
2-
4.5 GHz
+2.0
n=
2+
9.0 GHz
+2.4
n
~
1-
1.5 GHz
+3.0
n
~
3-
9.0 GHz
+4.4
n""' 1+
6.0 GHz
Use
the
formula below to determine
the
harmonic
mixing mode for modes not on the Frequency
Scales (i.e., 5, 7, 8 and 9).
2cm
ntrue
~
actual shift x (displayed n)
Figure 3-5. Slgnal Identification Technique (cont'd)
3-15

 Loading...