Operation
Adjust
INTENSITY
for
a visible scan trace
without
blooming.
ERASE
display as necessary
between adjustments. Adjust
BASE LINE CLIP-
PER
to
blank
lower
portion
of
scan trace. Repeat
adjustments as necessary during the following
steps.
INPUT ATTENUATION should be
set
to
at
least 20 dB before proceeding with the
following step.
Remove
50-ohm
termination
from SECOND
LO
OUTPUT
and
connect a cable from SECOND
LO
OUTPUT
to
RF INPUT.
Tune FREQUENCY
control
to position the
marker
under
the signal
between
the +2
and
+3
graticule lines.
Note reading on Frequency
Scale. Cursor indicates
1.5 GHz.
Switch SCAN WIDTH
to
PER
DIVISION. Center
signal
on
display with FREQUENCY control.
ERASE display
to
remove
stored
signals.
Set PERSISTENCE
to
MIN, SCAN WIDTH PER
DIVISION
to 1 MHz
and
SCAN TIME
to
20
MILLISECONDS.
Center
signal on display.
Set
SIGNAL IDENTJ.
F!ER
to
ON. Note signal shifts
to
the
left and
is
reduced in
amplitude
on
alternate
sweep scans.
Set
SCAN WIDTH PER DIVISION
to
20 MHz,
SCAN WIDTH
to
FULL, INPUT ATTENUATION
to
40
dB
and
SCAN TIME PER DIVISION
to
0.2
SECONDS.
Modei8555A
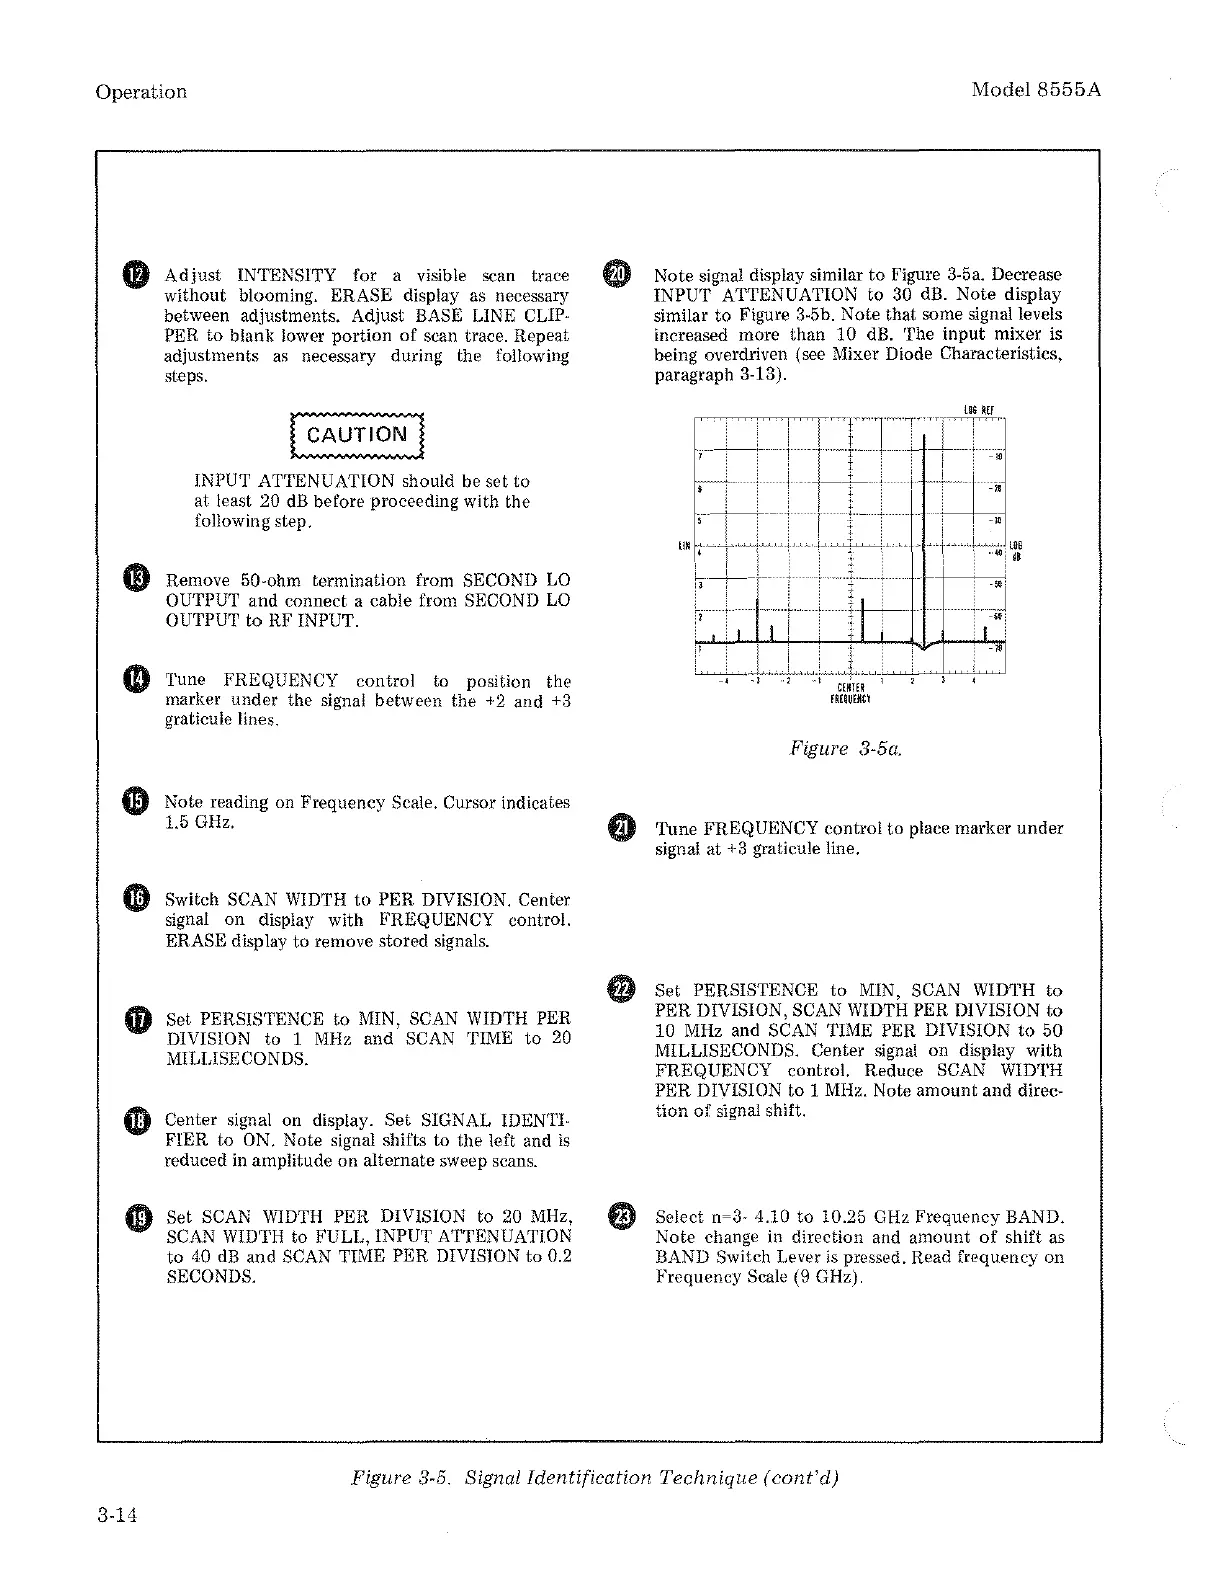
Note
signal display similar
to
Figure 3-5a. Decrease
INPUT ATTENUATION
to
30 dB.
Note
display
similar
to
Figure 3-5b.
Note
that
some signal levels
increased more
than
10
dB. The
input
mixer
is
being overdriven (see Mixer Diode Characteristics,
paragraph 3-13).
-~---
'
-
'
-~!-~-
.
_,.
i+-~
-·
li,
Iii
Figure 8-Sa.
Tune
FREQUENCY
control
to
place
marker
under
signal
at
+3 graticule line.
Set
PERSISTENCE
to
MIN, SCAN WIDTH
to
PER
DIVISION, SCAN WIDTH PER DIVISION
to
10
MHz and SCAN TIME PER DIVISION
to
50
MILLISECONDS. Center signal on display
with
FREQUENCY control. Reduce SCAN WIDTH
PER
DIVISION
to
1 MHz. Note
amount
and
direc-
tion
of
signal shift.
Select
n~3-
4.10
to
10.25 GHz
Frequency
BAND.
Note
change in direction and
amount
of
shift as
BAND Switch Lever
is
pressed. Read frequency on
Frequency
Scale (9 GHz).
Figure 8-5. Signal Identification
Technique
(cant'
d)
3-14