Model
8555A
•
Reduce
SCAN WIDTH PER DIVISION and
BANDWIDTH to separate other signals on the
dis-
play. Keep
the
signal
under
investigation centered
on the display.
Note direction and spacing
of
signal shift
on
the
CRT.
When
the correct harmonic (n)
number
and
sign(+
or-)
is selected
by
the
BAND Switch Lever,
the
Signal will shift two divisions
to
the
left. The
shifted signal
is
reduced in
amplitude
by
approxi-
mately 5 dB.
If
signal shifts to the right
two
divisions,
the
har-
monic number
is
correct, however the sign ( + or
-)
on the left edge
of
the Frequency Scale
is
wrong.
If
the
signal shifts less
than
two
divisions
on
the
CRT, press the BAND Switch Lever
"up"
to
increase the harmonic number. Note
that
the
signal shifts in
the
opposite
direction
with each
change in sign and increases in width with each
increasing harmonic
number.
Change Band Switch Lever until
the
signal shift
is
two divisions apart with
the
reduced signal on the
left. FINE
TUNE
to
align
the
reduced signal on
the
-2
graticule line with
the
signal
to
be identified
on the
Center Frequency graticule line.
Read frequency indicated
by
the cursor
on
the
Frequency Scale.
The
signal frequency
is
related to
the
first
LO
harmonic
by
the equation Fsig
""
nFLO
±IF.
where Fsig"" signal frequency
n
=harmonic
number
FLO~
LO
fundamental frequency
IF
~
frequency
of
first
IF
NOTE
In
the
following familiarization procedure
a known
input
signal
is
applied and
the
harmonic numbers producing
the
signals
on
the
CRT display are identified. The
input mixer
is
overdriven to produce
sig-
nals
that
would
not
normally be present
on
the
display.
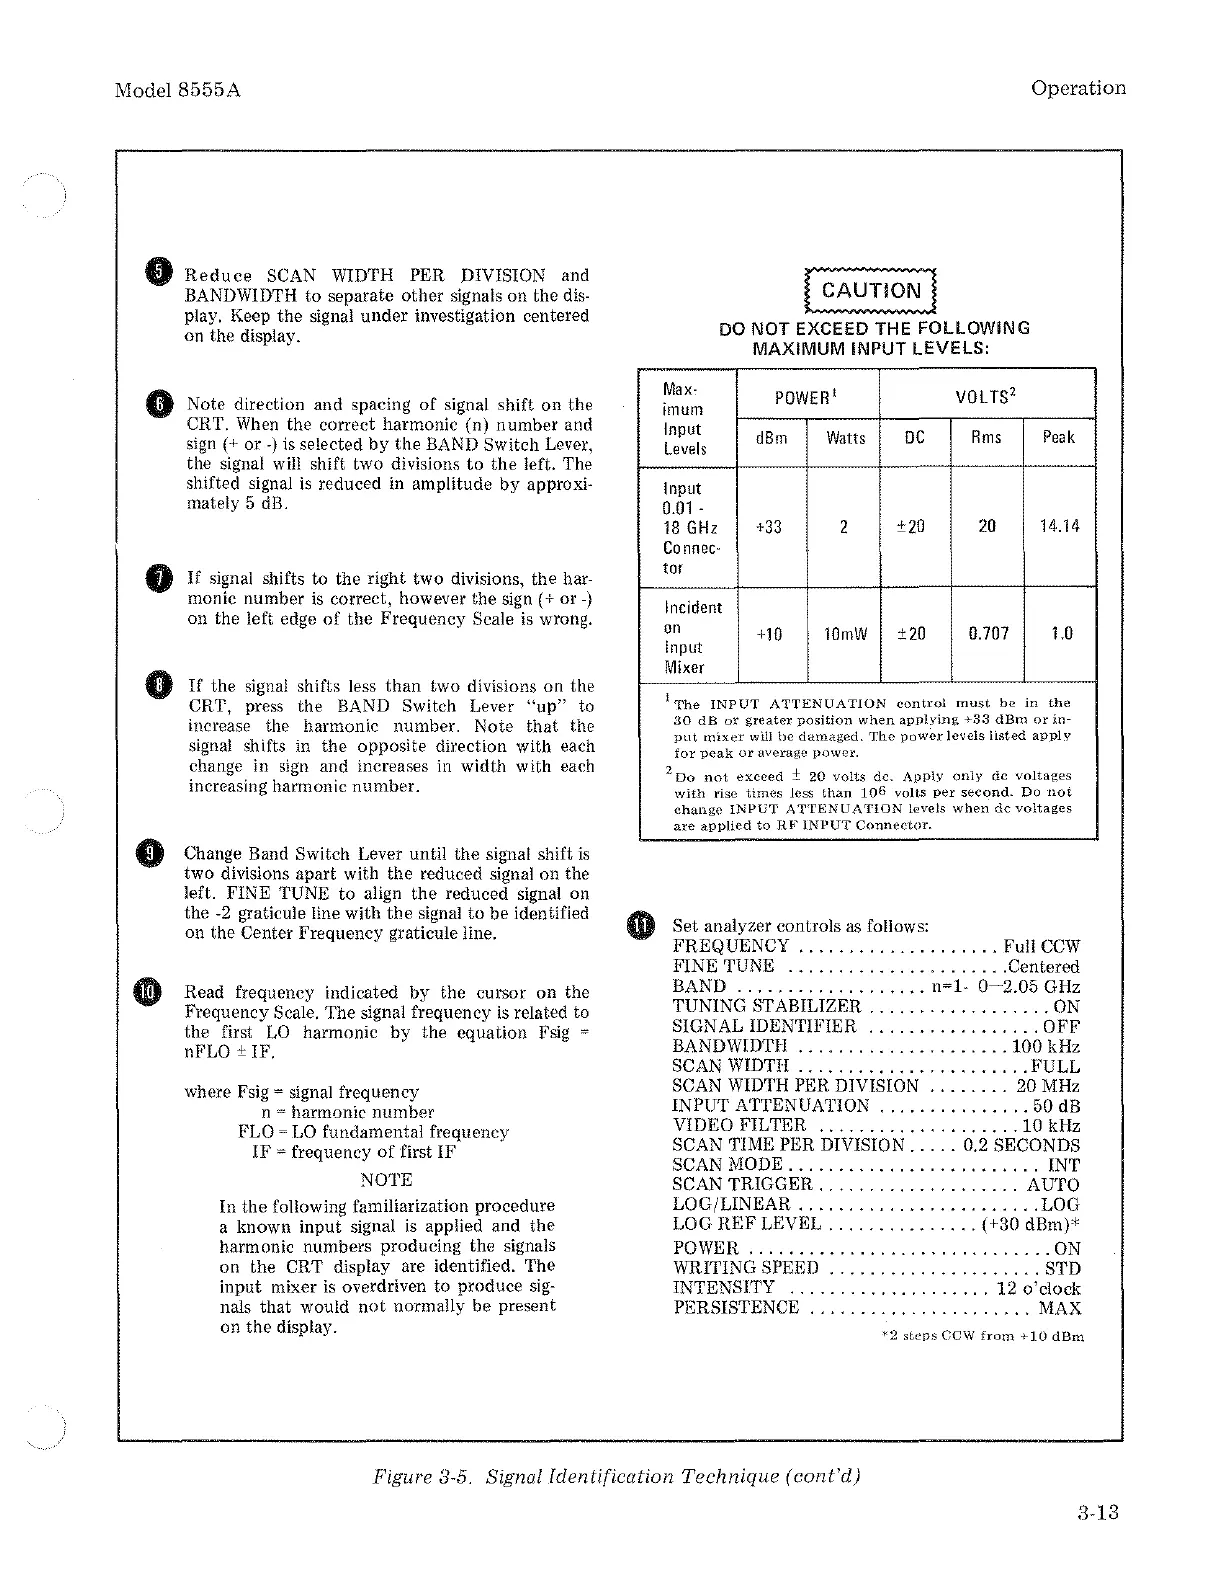
§~~~]
DO NOT EXCEED THE FOLLOWING
MAXIMUM
INPUT LEVELS:
Max·
POWER'
VOL
TS
2
imum
Input
dBm
Watts
oc
Rms
Levels
Input
0.01
-
18
GHz
+33
2
±20
20
Connec-
tot
Incident
on
+10
Input
10mW
±20
0.707
Mixer
Operation
Peak
14.14
1.0
1
The
INPUT
ATTENUATION
control
must
be
in
the
30
dB
or
greater
position
when
applying
+33
dBm
or
in-
put
mixer
will
be
damaged.
The
power
levels
listed
apply
for
peak
or
average
power.
2
Do
not
exceed
±
20
volts
de.
Apply
only
de
voltages
with
rise
times
less
than
106
volts
per
second.
Do
not
ehange
INPUT
ATTENUATION
levels
when
de
voltages
are
applied
to
RF
INPUT
Connector.
Set analyzer controls
as
follows:
FREQUENCY
....................
Full
CCW
FINE TUNE
......................
Centered
BAND
...................
n~1-
0~2.05
GHz
TUNING STABILIZER
..................
ON
SIGNAL
IDENTIFIER
.................
OFF
BANDWIDTH
.....................
100kHz
SCAN WIDTH
.......................
FULL
SCAN
WIDTH PER DIVISION
........
20 MHz
INPUT ATTENUATION
...............
50
dB
VIDEO FILTER
....................
10kHz
SCAN TIME PER DIVISION
.....
0.2 SECONDS
SCAN MODE
.........................
!NT
SCAN TRIGGER
....................
AUTO
LOG/LINEAR
........................
LOG
LOG
REF
LEVEL
...............
(+30 dBm)*
POWER
..............................
ON
WRITING SPEED
.....................
STD
INTENSITY
....................
12 o'clock
PERSISTENCE
......................
MAX
'¥2
steps
CCW
from
+10
dBm
Figure 3-5. Signal Identification Technique (cont'd)
3-13