EasyManua.ls Logo

HP 8753D - Page 271

HP 8753D
678 pages
Print Icon
To Next Page IconTo Next Page
To Previous Page IconTo Previous Page
Loading...
Data Processing
The
analyzer's
receiver
converts
the R,
A, and
B input
signals into
useful measurement
information.
This
conversion
occurs
in
two
main steps:
The
swept
high
frequency
input
signals
are translated
to xed
low frequency
IF signals
, using
analog
sampling
or
mixing
techniques
.
(Refer
to
the
HP
8753D Network
Analyzer Service
Guide
for
more
details
on the
theory of
operation.)
The
IF
signals
are
converted
into
digital data
by an
analog to
digital
converter
(ADC).
From
this
point
on,
all
further
signal
processing is
performed mathematically
by the
analyzer
microprocessors
.
The
following
paragraphs describe
the sequence
of math
operations and
the
resulting
data
arrays
as
the information
ows from
the ADC
to the
display
.
They
provide
a
good
foundation
for
understanding
most of
the response
functions,
and the
order
in
which
they
are
performed.
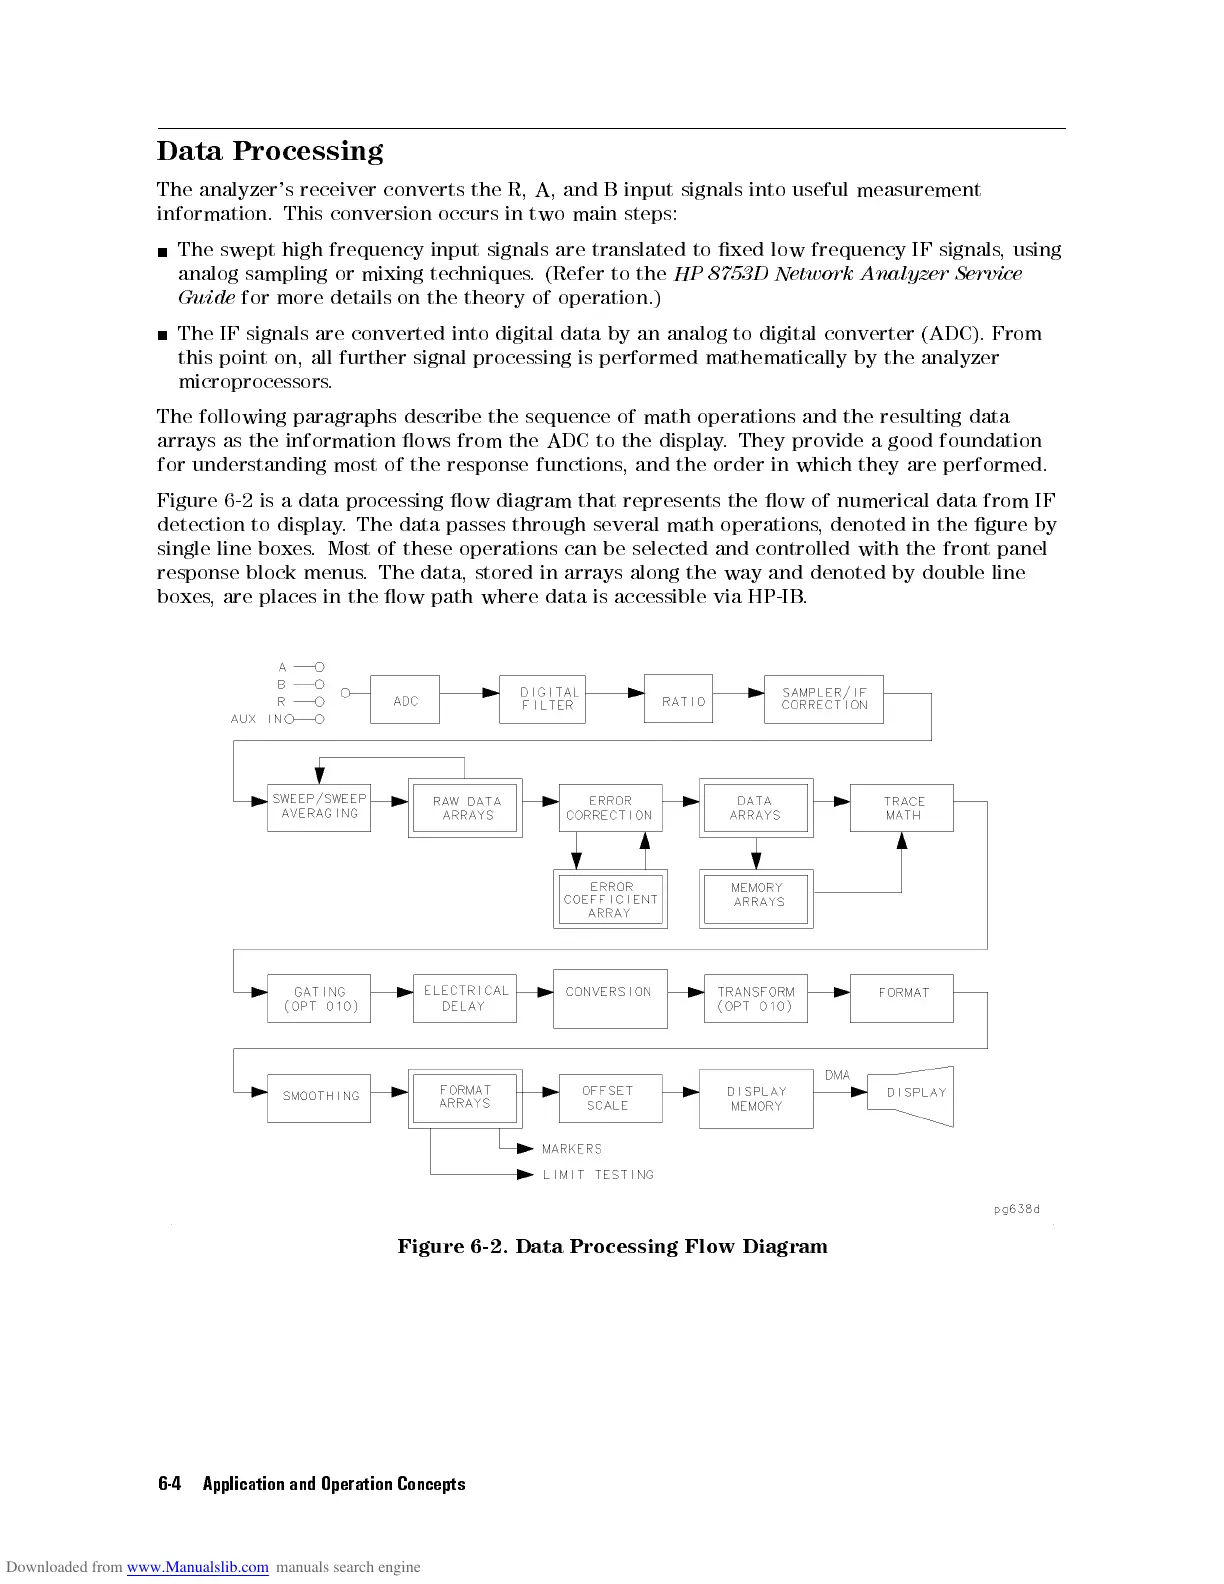
Figure
6-2
is a
data processing
ow diagram
that represents
the
ow
of
numerical
data
from
IF
detection
to
display.
The data
passes through
several math
operations
,
denoted
in
the
gure
by
single line
boxes.
Most
of
these
operations
can
be
selected
and
controlled
with
the
front
panel
response
block
menus
.
The
data,
stored in
arrays
along
the
way
and
denoted
by
double
line
boxes
,
are
places
in
the
ow
path
where
data
is
accessible
via
HP-IB
.
Figure 6-2. Data
Processing Flow Diagram
6-4 Application and Operation Concepts