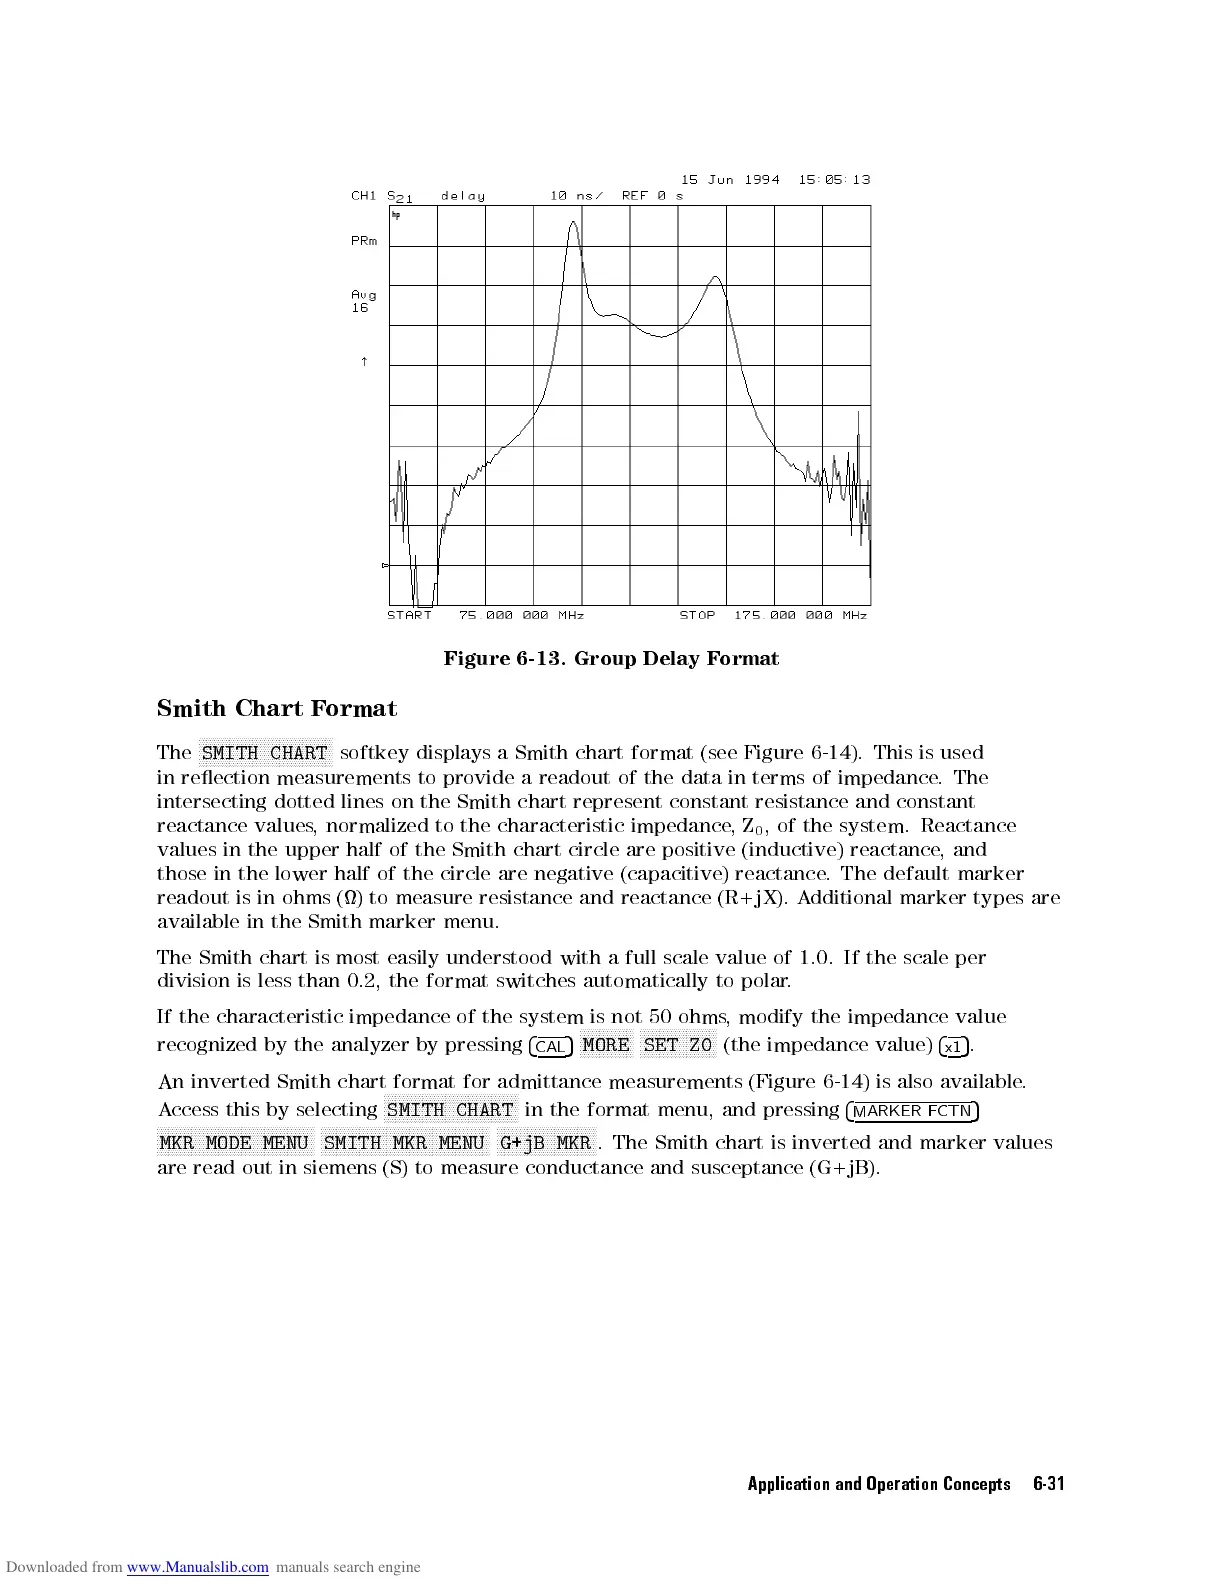
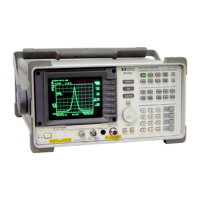
Figure 6-13.
Group Delay
F
ormat
Smith
Chart
F
ormat
The
N
N
N
N
N
N
N
NN
N
N
N
N
N
N
N
N
N
N
N
N
N
N
N
N
N
N
N
N
N
N
N
NN
N
SMITH
CHART
softkey
displays a
Smith
chart
format
(see
Figure
6-14
).
This
is
used
in
reection
measurements
to
provide
a
readout
of
the
data
in
terms
of
impedance
.
The
intersecting
dotted
lines
on
the
Smith
chart
represent
constant
resistance
and
constant
reactance
values
,
normalized
to
the
characteristic
impedance
,
Z
0
,
of
the
system.
Reactance
values
in
the
upper
half
of
the
Smith
chart
circle
are
positive
(inductive)
reactance
,
and
those
in
the
lower
half
of
the
circle
are
negative
(capacitive)
reactance
.
The default
marker
readout
is
in
ohms
()
to
measure
resistance
and
reactance
(R+jX).
A
dditional
marker types
are
available
in
the
Smith
marker
menu.
The
Smith
chart
is
most
easily
understood
with
a
full
scale
value
of
1.0. If
the scale
per
division
is
less
than
0.2,
the format
switches automatically
to polar
.
If
the
characteristic
impedance
of
the system
is not
50 ohms
,modify
the
impedance
value
recognized by
the analyzer
by
pressing
4
CAL
5
NN
NN
NN
N
N
N
N
N
N
N
N
MORE
NN
NN
NN
N
N
N
N
N
N
N
N
N
N
N
N
N
N
SET Z0
(the impedance
value)
4
x1
5
.
An
inverted
Smith
chart
format
for
admittance
measurements
(Figure
6-14
)
is
also
available
.
Access this by selecting
NNNNNNNNNNNNNNNNNNNNN
NNNNNNNNNNNNNN
SMITH CHART
in the format menu, and pressing
4
MARKER F
CTN
5
NNNNNNNNNN
NNNNNNNNNNNNNNNNNNNNNNNNN
NNNNNN
MKR MODE MENU
NNNNNNNNNN
NNNNNNNNNNNNNNNNNNNNNNNNN
NNNNNNNNN
SMITH MKR MENU
NNNNNNNNNN
NNNNNNNNNNNNNNNN
G+jB MKR
.
The Smith chart is inverted and marker values
are read out in siemens (S) to measure conductance and susceptance
(G+jB).
Application and Operation Concepts 6-31


 To Next Page