result
in the
group delay
data. These
errors
can
be
signicant
for
long
delay
devices
.
Y
ou
can
verify
that 1
is
180
by
increasing the
number
of
points
or
narrowing
the
frequency
span
(or
both)
until the
group
delay
data
no
longer
changes
.
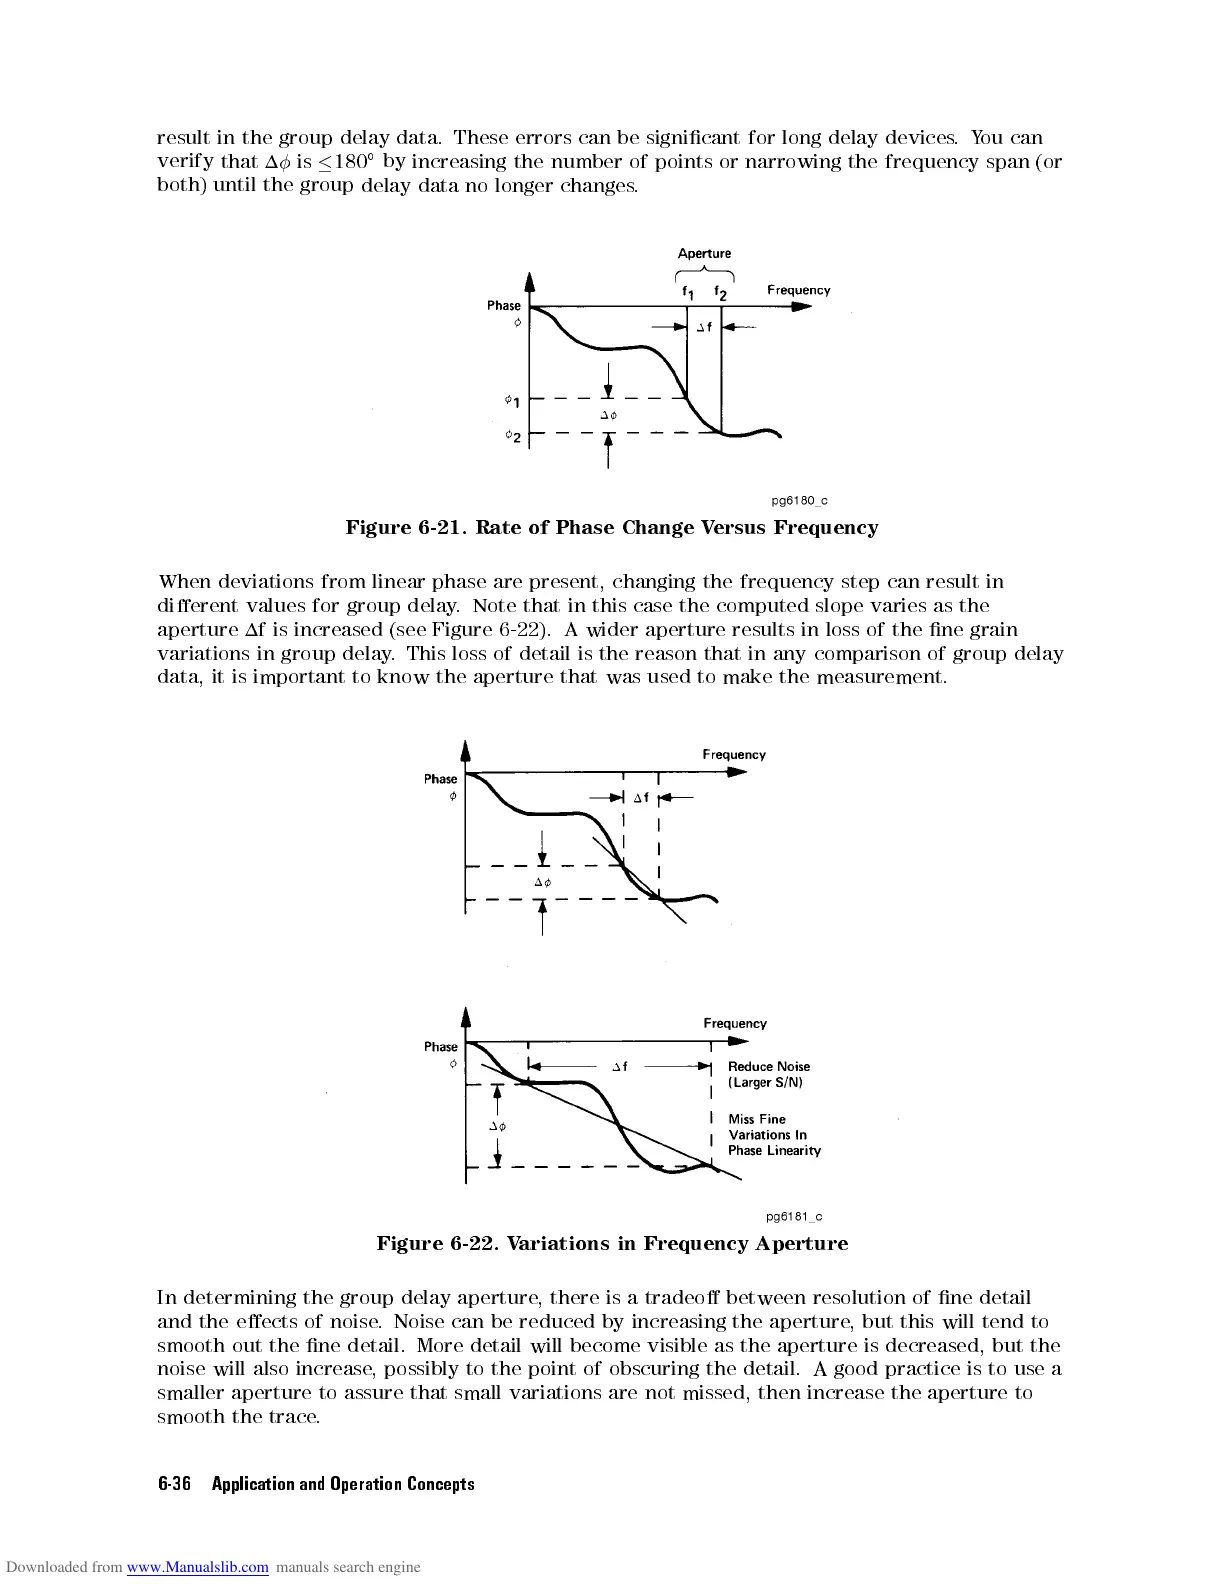
Figure
6-21. Rate
of Phase
Change V
ersus Frequency
When
deviations
from
linear
phase
are
present,
changing
the
frequency
step
can
result
in
dierent
values
for
group
delay
.
Note
that
in
this
case
the
computed
slope
varies
as
the
aperture
1f
is
increased
(see
Figure
6-22
).
A
wider
aperture
results
in
loss
of
the
ne
grain
variations
in
group
delay
.
This
loss
of
detail
is
the
reason
that
in
any
comparison
of
group
delay
data,
it
is
important
to
know
the
aperture
that
was
used
to
make the
measurement.
Figure 6-22. V
ariations in Frequency Aperture
In determining the group delay aperture, there is a tradeo between resolution of ne detail
and the eects of noise. Noise can be reduced by increasing the aperture, but this will tend to
smooth out the ne detail. More detail will become visible as the aperture is decreased, but the
noise will also increase, possibly to the point of obscuring the detail. A good practice is to use a
smaller aperture to assure that small variations are not missed, then increase the aperture to
smooth the trace.
6-36 Application and Operation Concepts


 To Next Page