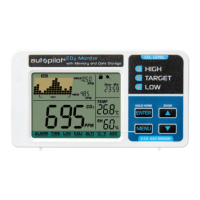
The trend chart displays the past readings for CO
2
, temperature and RH parameters. These readings
can be toggled by using the DOWN key: CO
2
, TEMP, RH. See below:
TREND CHART ZOOM
Below is a table that shows the available zoom levels for all parameters, as well as the duration of
each division for corresponding zoom levels:
Using UP will toggle the available zoom levels for each parameter. Note the Time Per Division in
addition to the Zoom Level.
MAX/MIN
At the top right corner of the display, there are two numerical indicators: MAX and MIN. As the zoom
level is changed, the MAX and MIN values will reflect the maximum and minimum values on the
chart of the selected CO
2
parameter. At startup, the unit will automatically display values for CO
2
.
CLOCK
The clock display is at the top right corner of LCD screen. You can adjust the date and time by
selecting TIME mode. We recommend that you set the date and time to your local settings
immediately upon setting up the unit if exporting of logged data is going to be necessary.
TREND CHART
ZOOM LEVEL (Time Span) (11) TIME PER DIVISION
1 MIN (minute) 5 sec /div
1 HR (hour) 5 m/div
1 DAY (day) 2 h/div
1 WEEK (week) 0.5 d/div
9
 Loading...