Icare HOME tonometer Instruction manual for health care professionals
English
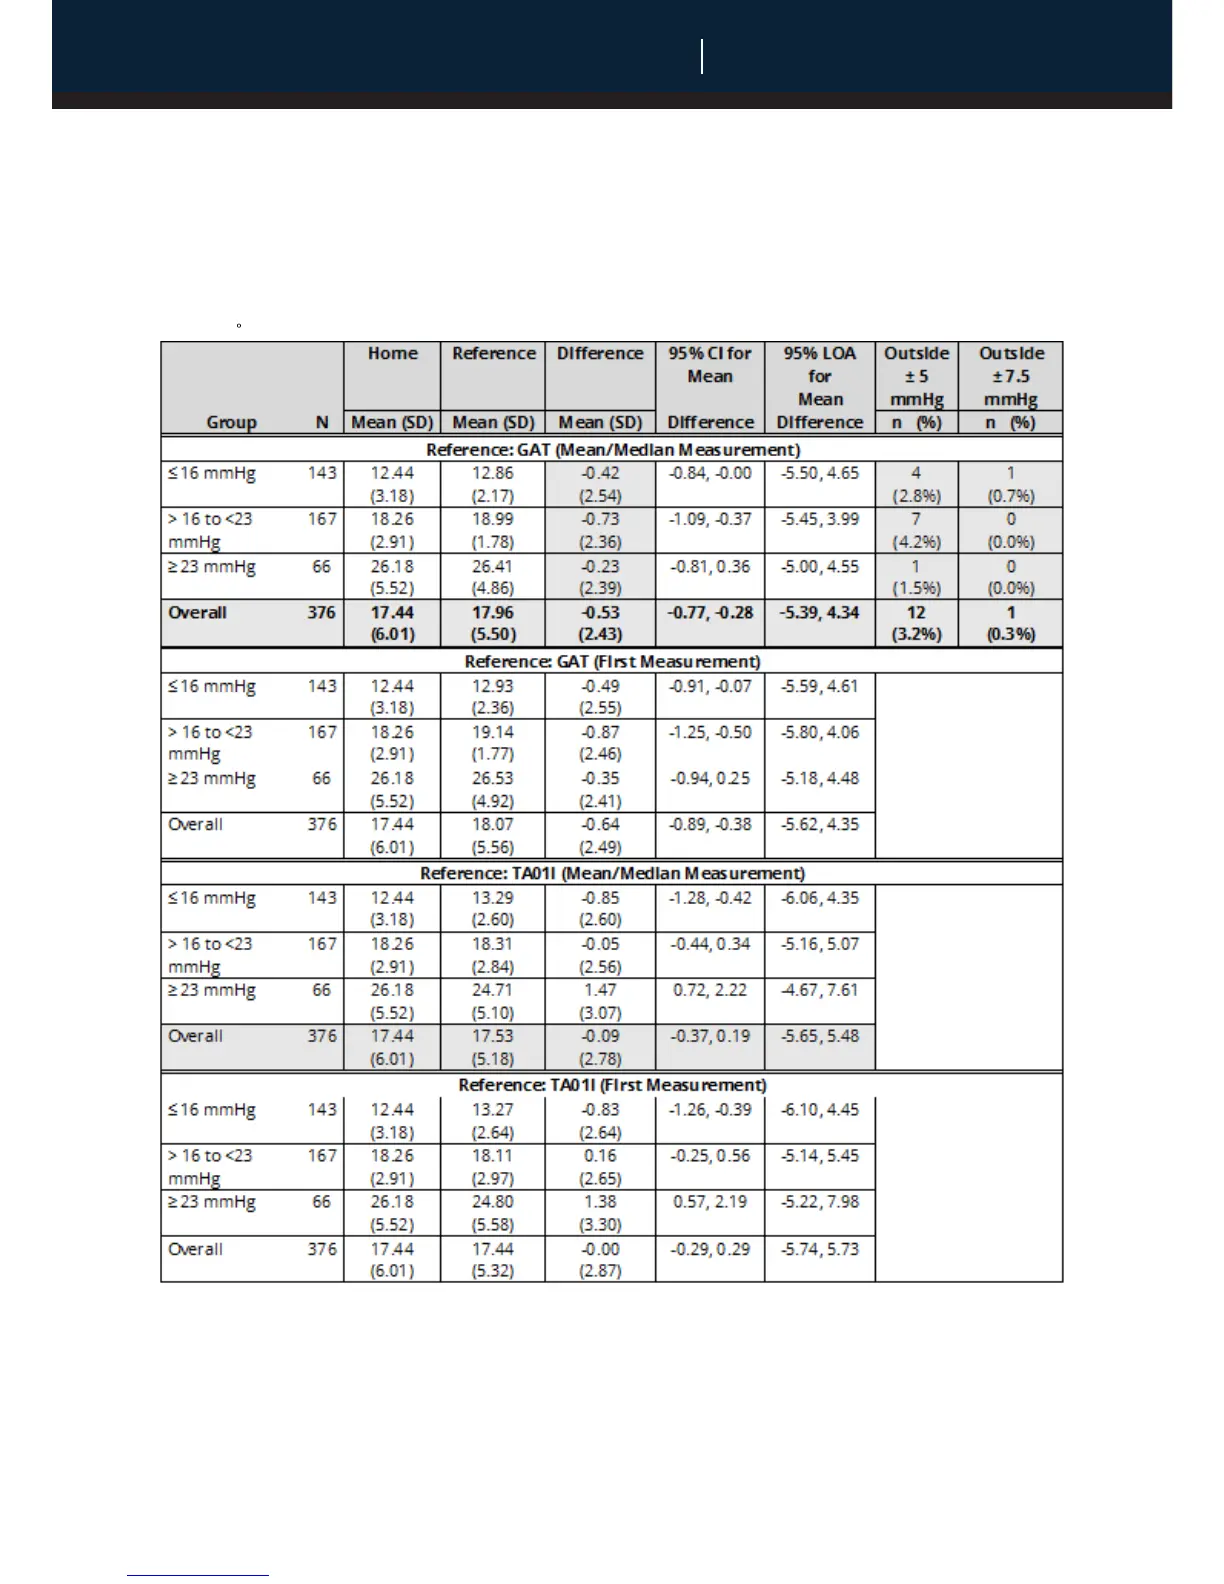
Table 3 provides the limits of agreement between the HOME tonometer and the two
reference tonometers. All ANSI performance goals were met as less than 5% of
measurements fell outside ± 5 mmHg at each pressure range and less than 1% fell
outside ± 7.5 mmHg at each pressure range.
Table 3. Limits of Agreement between Home and Reference Effectiveness Analysis
Cohort.
N is the number of eyes with measurements from both devices.
Difference = HOME - Reference. 95% confidence interval (CI) for mean difference is based on t-distribution.
95% limits of agreement (LOA) = mean difference ± 2 difference SD.
% = (n / N) x 100.
The first HOME IOP measurement of each study eye was used in the analysis.
Mean/Median: the median was used if the eye had three measurements. Otherwise, the mean was used if the eye had
two measurements.
CCT Home GAT Difference 95% CI for
Mean
95% LOA for
Mean
Outside
± 5 mmHg
Outside
± 7.5 mmHg
Group N Mean (SD) Mean (SD) Mean (SD) Difference Difference n (%) n (%)
500-520 94 17.43
(5.70)
18.01
(5.28)
-0.59
(2.46)
-1.09, -0.08 -5.50, 4.33 3
(3.2%)
0
(0.0%)
521-540 100 16.52
(6.50)
16.87
(5.99)
-0.
)
35
(2.03)
-0.75, 0.06 -4.40, 3.71 1
(1.0%)
0
(0.0%)
541-560 95 17.98
(6.55)
18.28
(5.93)
-0.
)
30
(2.59)
-0.83, 0.23 -5.47, 4.87 3
(3.2%)
0
(0.0%)
561-580 57 17.70
(5.53)
18.61
(4.72)
0.
)
9 1-
(2.86)
-1.67, -0.15 -6.64, 4.81 4
(7.0%)
1
(1.8%)
581-600 30 18.33
(4.03)
19.25
(3.87)
-0.
)
92
(2.22)
-1.75, -0.09 -5.36, 3.53 1
(3.3%)
0
(0.0%)
Overall 376 17.44
(6.01)
17.96
(5.50)
-0.
)
53
(2.43)
-0.77, -0.28 -5.39, 4.34 12
(3.2%)
1
(0.3%)
N is the number of eyes with measurements from both devices. Difference = HOME - Reference. 95% confidence interval
(CI) for mean difference is based on t-distribution. 95% limits of agreement (LOA) = mean difference ± 2 difference SD. %
= n N 100. The first HOME IOP measurement of each study eye was used in the analysis. The Mean/Median of GAT
was used in the analysis: the median was used if the eye had three measurements. Otherwise, the mean was used if the
eye had two measurements.
Precision: Table 5 provides the repeatability analyses for all measurements in the
effectiveness analysis cohort. The HOME CV% was comparable for the low and medium
IOP range (~10% for each bin) and smaller for the high IOP range (~7.5%).
Table 4 provides the limits of agreement between Icare HOME and GAT by
central corneal thickness. Icare HOME slightly underestimates IOP compared to GAT over
the corneal thickness range 500-600 μm.
Table 4. Limits of Agreement between HOME and GAT by Central Corneal Thickness (CCT)
Effective Analysis
Table 5. Repeatability - All Measurements of Effectiveness Analysis Cohort
All statistics are estimated from a random-effect model with study eye and error as the random effect. Mean =
Intercept of the ANOVA model. Repeatability SD = Square root of the residual variance. Repeatability limit = 2.8 x
Repeatability SD.
 Loading...