EasyManua.ls Logo

INSIGHT G SERIES User Manual

INSIGHT G SERIES
44 pages
To Next Page IconTo Next Page
Page #1 background imageLoading...
Page #1 background image
G SERIES PILOT’S GUIDE .
INSIGHT INSTRUMENT CORPORATION BOX 122, FORT ERIE, ONTARIO, L2A 5M6
1
PILOT’S GUIDE
FOR INSIGHT G SERIES
SOFTWARE VERSION 308 & UP FOR G2 & G3
SOFTWARE VERSION 208 & UP FOR G4 SINGLE, G4 TWIN & 145 FOR G9
Instrument Corp.

Table of Contents

Question and Answer IconNeed help?

Do you have a question about the INSIGHT G SERIES and is the answer not in the manual?

INSIGHT G SERIES Specifications

General IconGeneral
Image Frequency9 Hz
TypeThermal Camera
Emissivity CorrectionYes (Adjustable)
Image StorageInternal memory
File FormatBMP
Battery TypeRechargeable Lithium-ion battery
Accuracy±2°C or ±2% of reading
Resolution0.1°C
Operating Humidity10% to 90% non-condensing
FocusFocus Free

Summary

Warranty and Service

Technical Support

G Series Pages & Functions

Guide To The G Series Screens

G Series Function Comparison List

G1 Color Graphic Engine Monitor

G1 Screens In Order

1 - Main Screen

Shows the primary display of engine parameters on the G1.

2 - Lean Screen

Displays engine data relevant to fuel leaning procedures on the G1.

3 - Probe Diagnostic Screen

Shows diagnostic information for temperature probes on the G1.

G2 Color Graphic Engine Monitor

G2 Screens In Order

1 - Main Screen

Shows the primary display of engine parameters on the G2.

2 - Lean Screen

Displays engine data relevant to fuel leaning procedures on the G2.

3 - Probe Diagnostic Screen

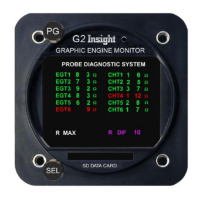
Shows diagnostic information for temperature probes on the G2.

4 - User Configuration Screen

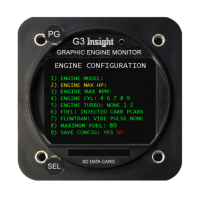
Allows users to configure various settings for the G2 instrument.

5 - Enter Total Fuel Screen

Input screen for initial fuel quantity for totalization on G2.

6 - Fuel Function Screen

Displays fuel totalization and related data on the G2.

G3 Series Introduction

G3 and G4 Screens In Order

1 - Main Screen

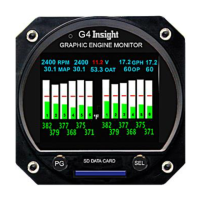
Primary display of engine parameters for G3/G4.

2 - Probe Diagnostic Screen

Shows diagnostic information for temperature probes on G3/G4.

3 - EGT Periodic Temperature Variation Screen

Displays EGT variation for engine analysis on G3/G4.

4 - Engine Vibration Screen

Shows vibration spectrum analysis for engine health on G3/G4.

5 - Take-Off Performance Screen

Displays performance data during takeoff on G3/G4.

6 - Turbulence Screen

Shows turbulence data using G-force measurements on G3/G4.

7 - Theoretical Horsepower Screen

Displays calculated theoretical horsepower for the engine on G3/G4.

8 - Air Data Screen

Shows air data information such as OAT and IAS on G3/G4.

9 - Dynamic G-Force Screen

Displays live G-force measurements for G3/G4.

10 - Dynamic Snapshot Screen

Shows a captured snapshot of G-force data on G3/G4.

11 - User Configuration Screen

Allows users to configure various settings for the G3/G4 instrument.

12 - Enter Total Fuel Screen

Input screen for initial fuel quantity for totalization on G3/G4.

13 - Fuel Function Screen

Displays fuel totalization and related data on the G3/G4.

G4 Series Introduction

G4 Twin Engine

G4 Twin Screens In Order

Right Engine

Displays engine parameters for the right engine of a G4 Twin.

Left Engine

Displays engine parameters for the left engine of a G4 Twin.

G4 Twin Screens In Order PG 1

1- Twin Engine Page

Primary twin engine display screen.

2- Navigate Right Engine

Procedure to switch to the right engine display.

3- Navigate Left Engine

Procedure to switch to the left engine display.

4- Left Engine Probe Page

Shows probe diagnostic information for the left engine.

5- Right Engine Probe Page

Shows probe diagnostic information for the right engine.

6- EGT Variation Page

Displays EGT variation for engine analysis.

7- Vibration Spectrum Page

Shows vibration spectrum analysis for engine health.

8- Takeoff G Force Page

Displays performance data during takeoff.

9- Turbulence G Force Page

Shows turbulence data using G-force measurements.

G4 Twin Screens In Order PG 2

10- Hard Landing G Force Page

Displays G-force data related to hard landings.

11- Hard Landing Graph Page

Shows a graph of hard landing G-force data.

12- Horsepower Page

Displays calculated theoretical horsepower for the engine.

13- Air Data Interface Page

Shows air data information such as OAT and IAS.

14- User Configuration Page

Allows users to configure various settings for the instrument.

15- Set Fuel Page

Input screen for initial fuel quantity for totalization.

First Flight With The G3-4

Using G3-4 On The Ground

Using G3-4 On Take-off

Leaning for Take-off

A New Approach to Engine Management

Fundamentals of EGT

Principles of EGT Measurement

Principles of CHT

G3 and G4 Configuration Screens

Registration Config

Screen for aircraft registration data logging.

General Information

Screen for raw measurement diagnostics.

Engine Configuration

Screen for setting up engine parameters for accurate readings.

Set Time/Date

Screen for entering the correct time and date for data logging.

K-Factor Initialization

Screen for setting up the fuel transducer for accurate fuel flow.

MISC Configuration

Screen for miscellaneous settings like GPS and temperature units.

G3-4 Operating Procedure

Main Screen Description

Explains the main display screen, including EGT, CHT, and other parameters.

LEAN OF PEAK

RICH OF PEAK

Setting The Peak Detect Threshold

Restarting The Leaning Process

Leaning in Cruise

Leaning Normally Aspirated Engines in Climb

Leaning the Engine in Cruise without Lean Mode

Leaning by Turbine Inlet Temperature

Leaning Restrictions

Importance of Measuring Turbine Inlet Temperature

Special Considerations for Turbos

Special Considerations for Twins

G3-4 MONITORING

The Bar-Graph Display Screen

Explains the interpretation of Exhaust Gas Temperature (EGT) and Cylinder Head Temperature (CHT) bar graphs.

PROBE DIAGNOSTIC Screen

PERIODIC TEMPERATURE Variation Screen

VIBRATION SPECTRUM Engine Vibration Screen

Vibration Analysis

TAKE-OFF PERFORMANCE Take-off Display

2-AXIS G-LOAD Turbulence Display

Live Dynamic G-Force Screens

T.H.P. Theoretical Horsepower Display

Auto Range Capability On User Configuration

Using Auto Range Function (Method 1)

Step-by-step guide to turning auto range ON or OFF.

Manual Configuration of Temperature Bargraph

Setting Bargraph Manually (Method 2)

Manual adjustment of temperature bargraph display settings.

AUTORANGE INFLECTION & EGT MAX TEMP Explained

Explains the meaning and function of Autorange Inflection and Max EGT Temp.

EGT Smoothing

Adjusting the bar heights from the main screen (Method 3)

Fuel Function Screens

FF Stability

Explains the FF Stability parameter for fuel flow accuracy.

Adjust K-Factor On G2-3-4

Setup GARMIN 400/500 For Fuel Display

Configuring the G3-4 For Your Engine's Fuel System

Registration Config

Screen for aircraft registration data logging.

Engine Configuration

Screen for setting up engine parameters for accurate readings.

Configuring the Fuel System Type

DATA-LOGGING Mark Event In Log File

Introduction to Data-Logging

Flight File Open In Excel

Related product manuals