D-0004578-R – 2022/05 Page 45
Affinity2.0/Equinox2.0 - Instructions for Use - US
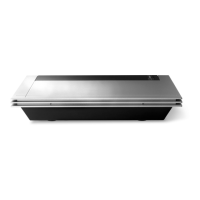
Current Protocol is listed in the lower left-hand corner.
The indicates the test is a part of an automatic test flow (Auto
Run). When pressing START all tests with the tick mark will be
performed.
If you wish to perf orm one test only, mark it
using the mouse by clicking on it. Then right
click at select Run this test.
Upon performing a test, the system automatically jumps to the next
one in the test flow.
indicates that a curve has been measured.
Colour indication shows the colour selected for each curve.
Test p rotocols can be created and adjusted in the HIT440 Setup.
Start/Stop button initiates and ends all tests.
Note that af ter pressing START the text on the button will
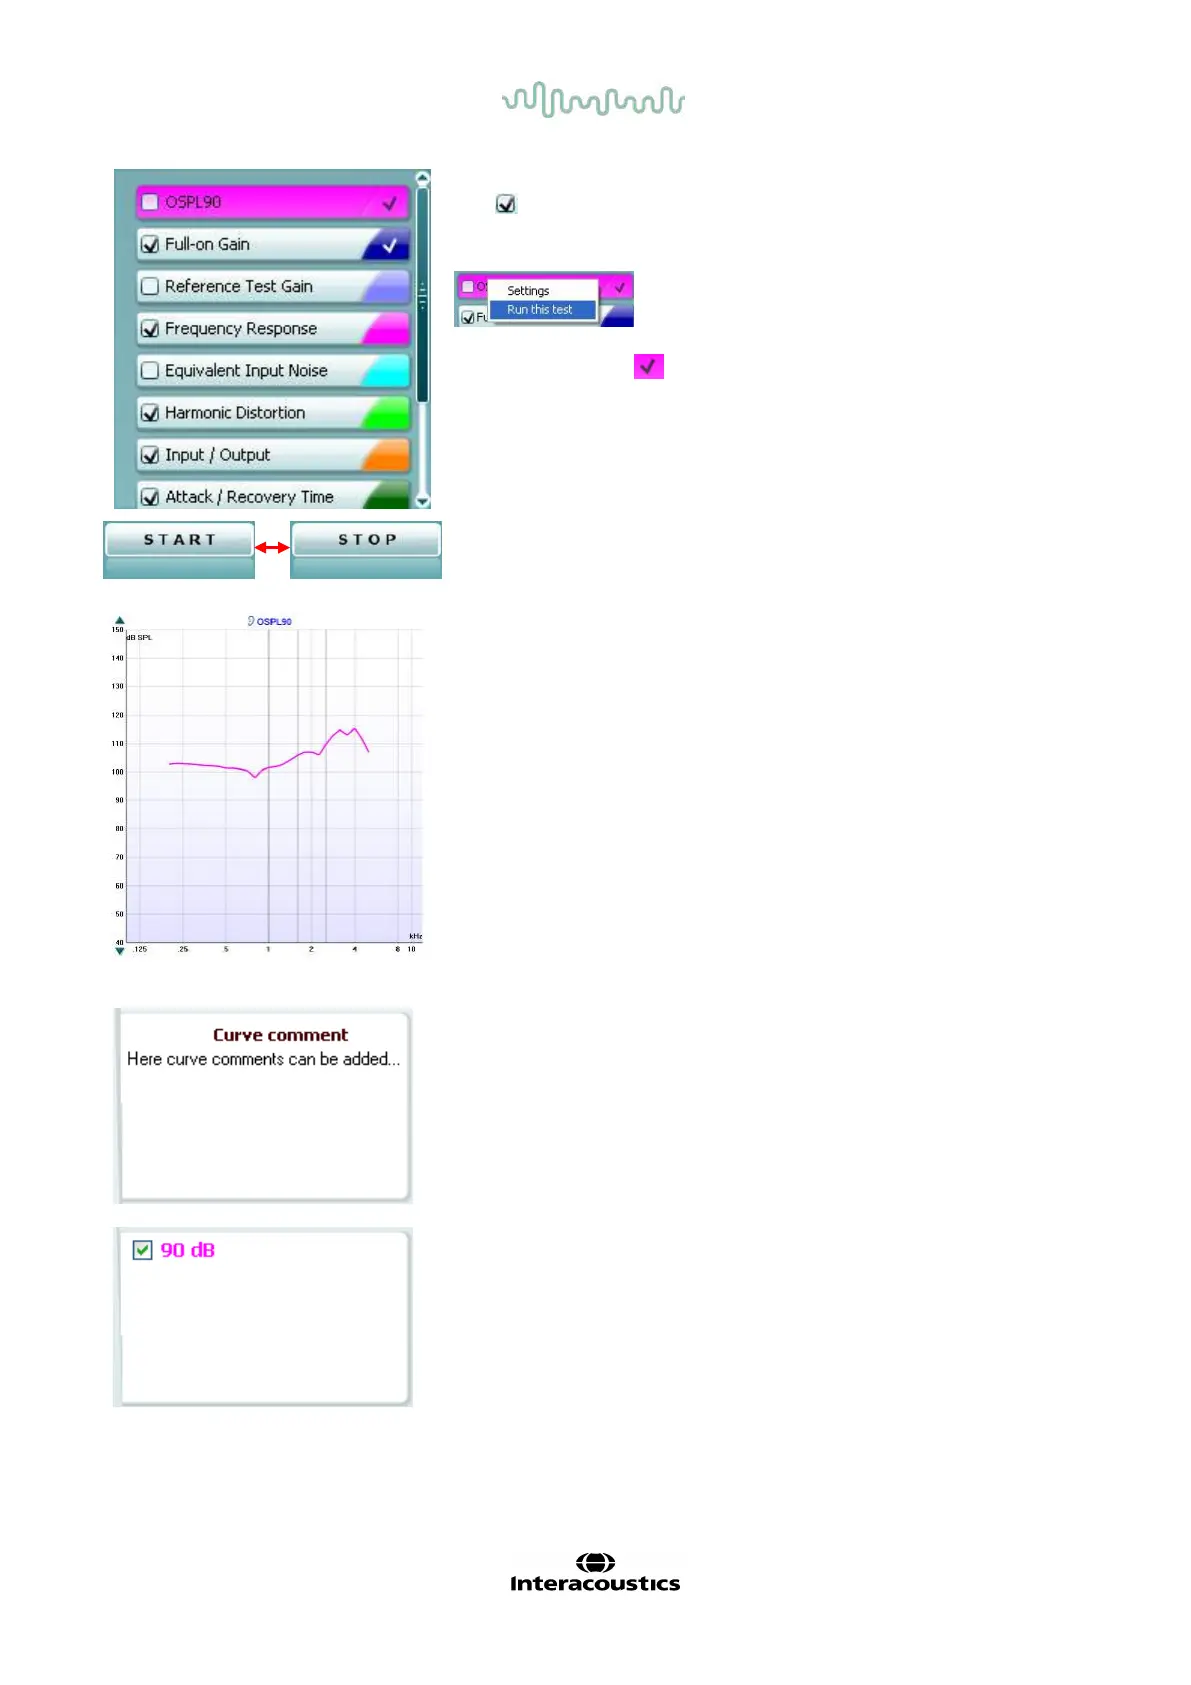
The Graph shows measured HIT curves. The X axis shows the
frequency, and the Y axis shows output or gain, depending on
which measurement was done.
Measurement type is printed above the graph together with a
right/left indication. In this example the OSPL90 is displayed for
the lef t ear.
Change the input level using the slider on the right-hand side.
NOTE: f or the industry standard protocols (ANSI and IEC), the
input level is dictated by the standard and cannot be changed.
Scroll graph up/down on the left-hand side allows for scrolling
the graph up or down ensuring that the curve is always visible in
the middle of the screen.
A Curve Comment f or each curve can be typed into the
comment section on the right-hand side.
Select a curve using the curve tag boxes under Curve display
options and write a comment in the comment section.
The comment will then appear in the comment section
whenever the curve is selected.
Curve Display Options are found in the lower right-hand
corner.
If you have measured more curves of the same type (e.g.
Frequency response curves), they will be listed by their input
level. Tick the ones that are to be displayed on the graph.
The hardware indication picture indicates whether the
hardware is connected.
When opening the Suite, the system will search f or the hardware. If it does not detect the hardware,
then the system will automatically continue in simulation mode.