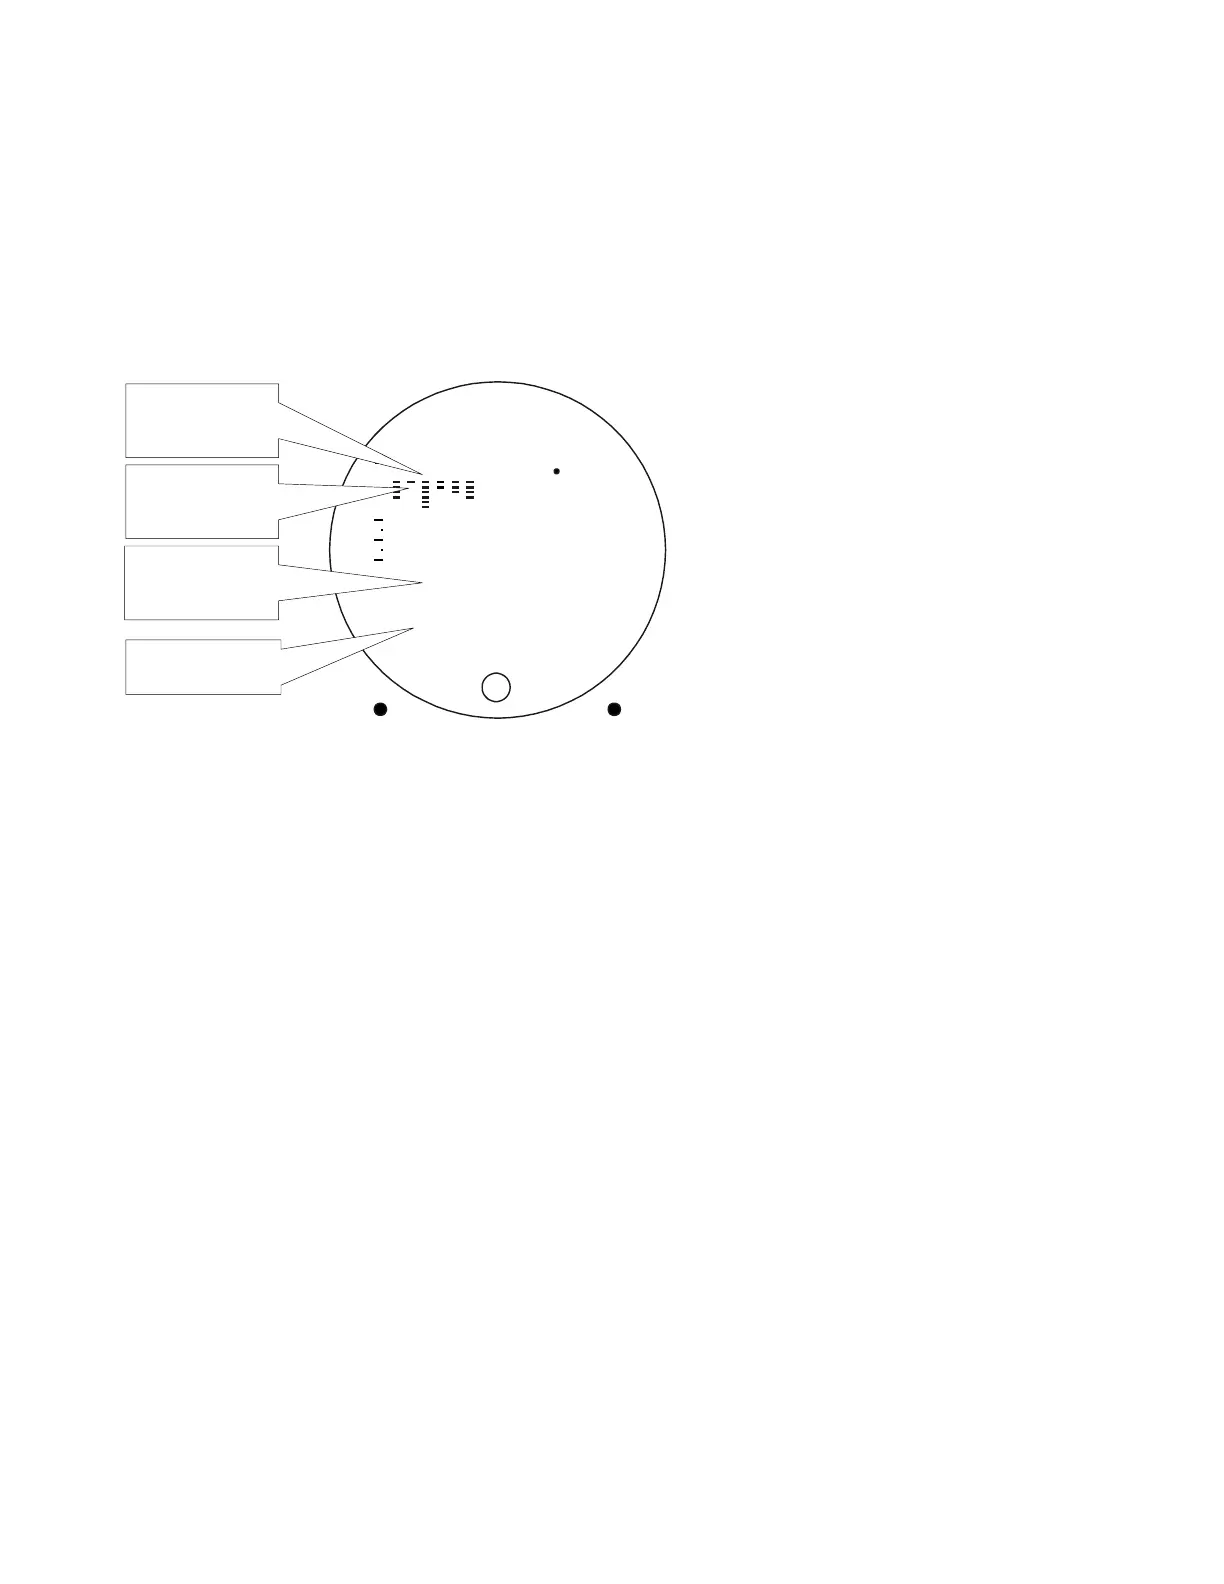
In the “lean of peak” method the columns will invert with the first to peak
progressing down from the top of the display. The inverted column scale
is 5° per segment below peak. As you continue to lean past peak the dot
of the each successive cylinder will flash as it peaks. The peaks will be
shown as an inverted bar graph; when the last cylinder peaks its column
will flash. The analog display is an inverted bar graph showing where
each cylinder peaked. When the LF button is held the display will show
the delta fuel flow between the first and last to peak (GAMI Spread), as
well as the richest peak EGT.
-5
STEP LF
_
%
MAX
_
J
P
I
1 2 3 4 5 6 T
° F L R P
7.3
EGT
EDM-760
Leaning LEAN of Peak
1 2 3 4 5 6 T
300
400
500
CHT
Temperature below
peak of the last
cylinder to peak
Current fuel flow
rate
Largest column is
the first cylinder to
peak
Shortest column is
the last cylinder to
peak
Fine Tuning the Mixture
Fuel flow is the critical issue in the leaning process. Uniform fuel
distribution to all cylinders results in the best economy and smooth
operation. Estimate the uniform fuel distribution by the heights of the
EGT columns on the analog display. Uniform fuel balance among all
cylinders occurs when the heights of the columns, displayed in Percentage
view, are uniform. Minor adjustments in throttle position, RPM, and
mixture settings can dramatically improve uniformity of the fuel
distribution. In fuel injected engines, interchanging injector nozzles
between high and low EGT cylinders will improve fuel distribution in
many cases.
For Your Safe Flight Page 21
 Loading...