MANUAL DE INSTRUCCIONES CODIGO 80243 REV A Enero /11 (Sujetas a modicaciones sin previo aviso) Pag.: 40
J.P. SELECTA s.a. Ctra. NII Km 585.1 Abrera 08630 (Barcelona) España Tel 34 93 770 08 77 Fax 34 93 770 23 62
e-mail: selecta@jpselecta.es - website: http://www.jpselecta.es
sample 2, the operation is the same as sample 1.
Repeat the operation step by step, till the last sample nished, and then it goes back
to the setting screen.
Note:
1. The samples Abs. or T% will not be displayed on the screen, they were saved in
the RAM.
2. The range or concentration is 0-9999, other number is invalid.
3. The concentration sequence goes from low to high.
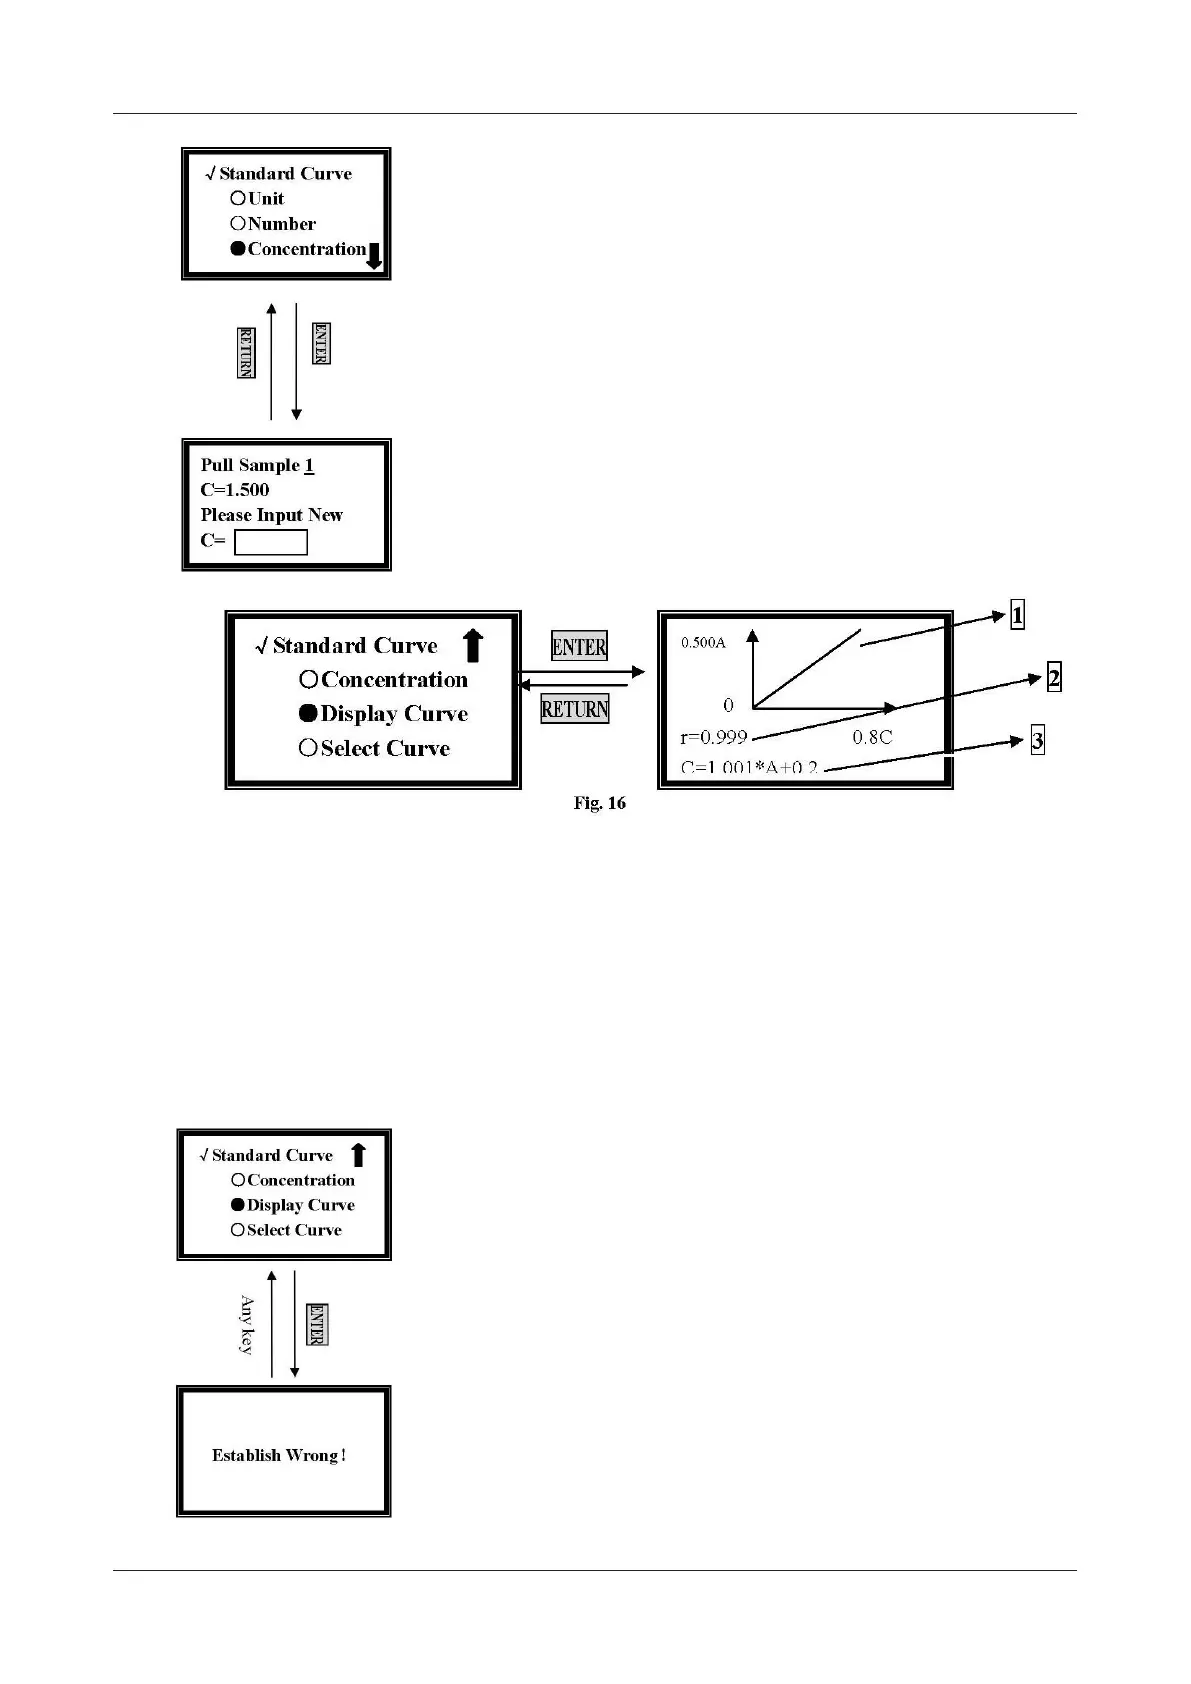
Display Standard Curve
Move the cursor onto Display Curve by pressing [»] and [«], and then press [EN-
TER]. The standard curve you just established will be displayed on the screen. The
equation displays on the bottom of the screen. (Fig. 16), and it will also be saved
in the system.
1. Standard Curve
2. Relative Coefcient.
3. Curve Equation
C=1.001*A+0.2
C: Concentration
A: Value of Abs.
The slop value of the curve is 1.001.
The intercept of the curve is 0.2.
If the system gives a fault hint, check the standard sample and your input, and then
press any key to return and repeat your performance. (Fig. 17)
Select Curve
Move the cursor onto Select Curve by pressing [»] and [«], and then press [EN-
TER] to conrm. (Fig. 18)
The newly established curve equation will be displayed at the end of the
group. A total of 200 curve equations can be saved.
Move the cursor on the equation you need by pressing [»] and [«], and then you
will return to the previous setting screen after [ENTER] being pressed.
Figure 15
Figure 17