INSTRUCTION MANUAL CODE 80243 REV A January/11 (It can be modied without notice) Page: 47
J.P. SELECTA s.a. Ctra. NII Km 585.1 Abrera 08630 (Barcelona) España Tel 34 93 770 08 77 Fax 34 93 770 23 62
e-mail: selecta@jpselecta.es - website: http://www.jpselecta.es
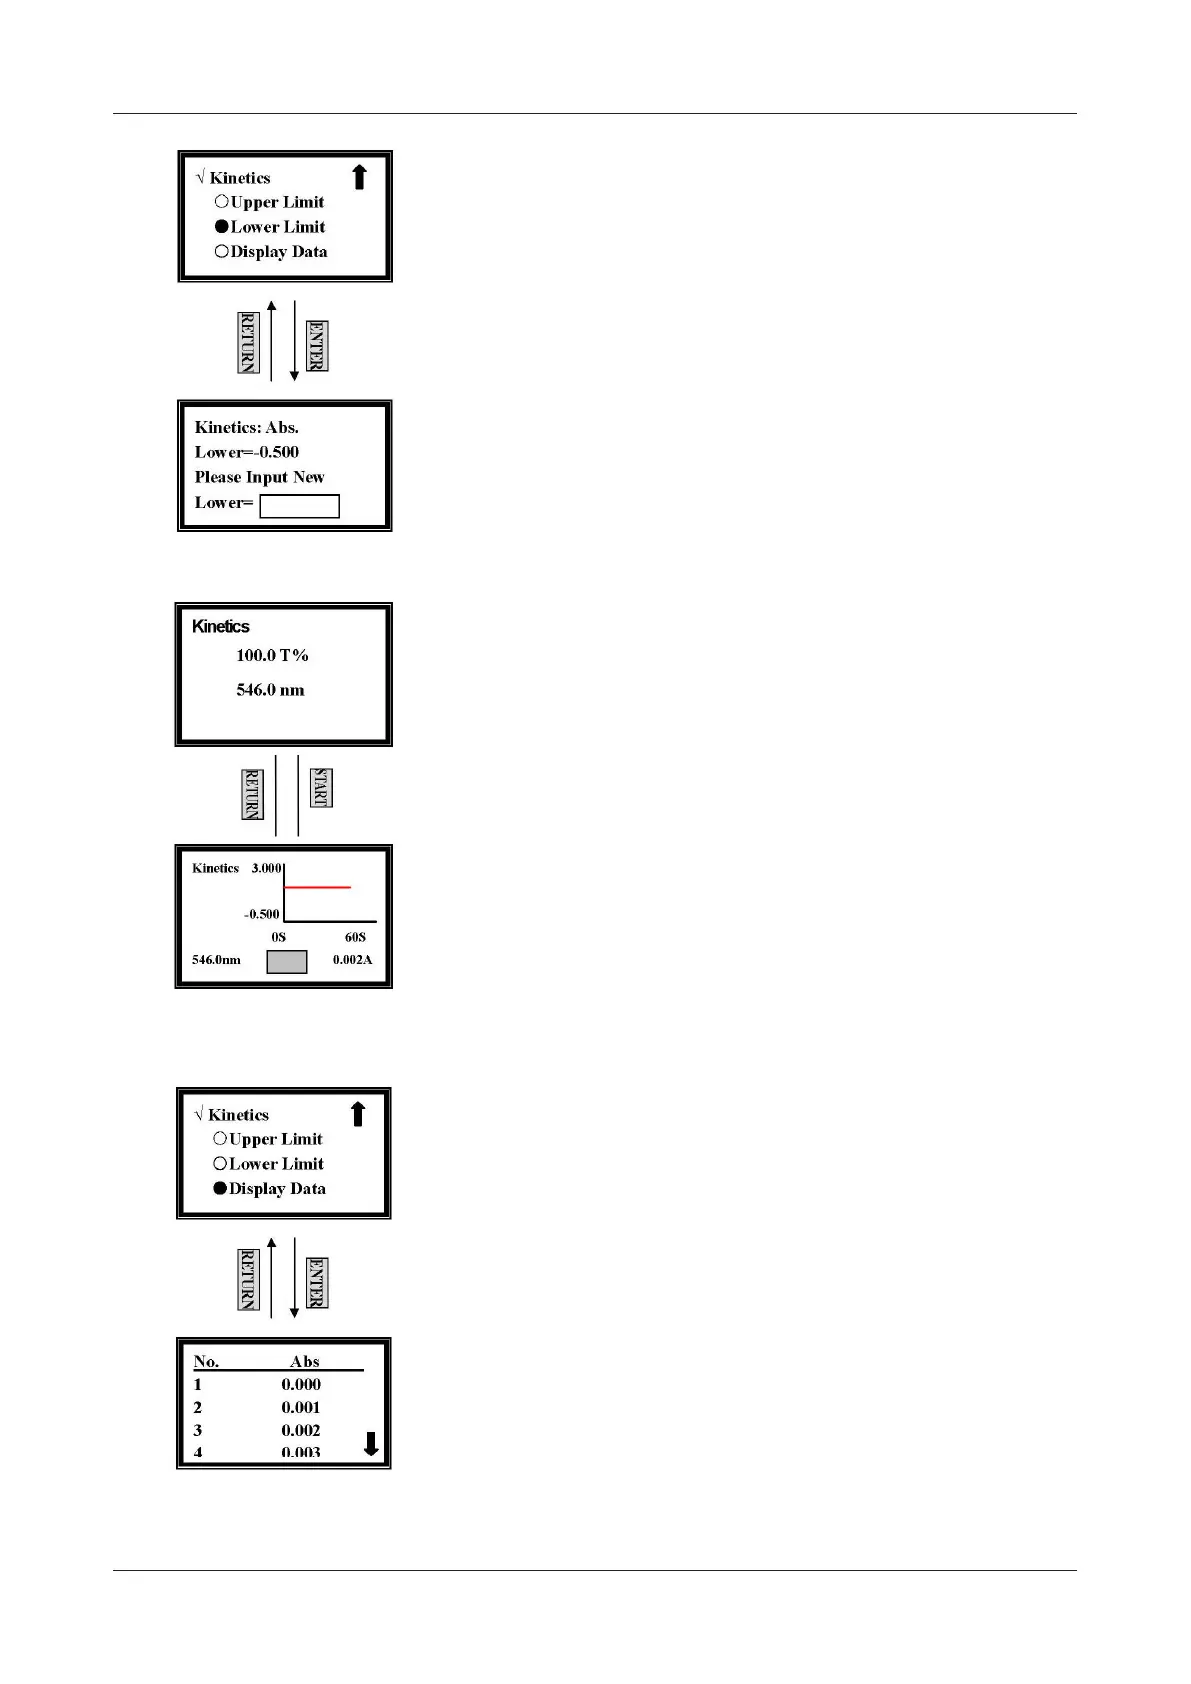
followed by [ENTER] (Fig.36)
Input the new lower value by pressing the numeric keypad and then press [ENTER],
and it will return to the kinetics setting screen.
If you don’t want to change the value being set last time, press [ENTER] or [RE-
TURN] directly.
Note:
The range or A is -0.3 - 3, the range or T is 0 - 200, other value is invalid.
Sample Test
After you have nished setting Time Interval, Total Test Time, Test Mode, Upper
Limit and Lower Limit, press [RETURN] to go back to the kinetics pre-testing
screen. (The upper display of Fig. 37)
Pull the blank cuvette in the light path, then press [ZERO] for blanking.
Pull the sample cuvette in the light path, and then press [START] to go into the
testing screen.
Press [START] again to begin your test. (Fig. 37)
When the testing begins, the curve will be drawn on the screen in real time. And the
time will also be displayed in the middle of the bottom screen in real time.
Press [STOP] to interrupt the test. When [START] is being pressed again, the test
will start again from the very beginning.
Note:
The curve cannot be printed, if you want to check the data of every dot, you can
choose Display Data in the parameter setting screen.
Display Data
Move the cursor onto Display Data by pressing [»] and [«] in the setting screen,
followed by [ENTER]. (Fig. 38)
Five lines of data will be displayed on every screen. Press [»] and [«] to scroll.
Figure 36
Figure 37
Figure 38