k,*,j
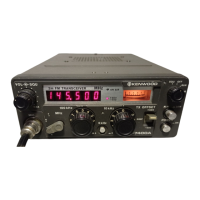
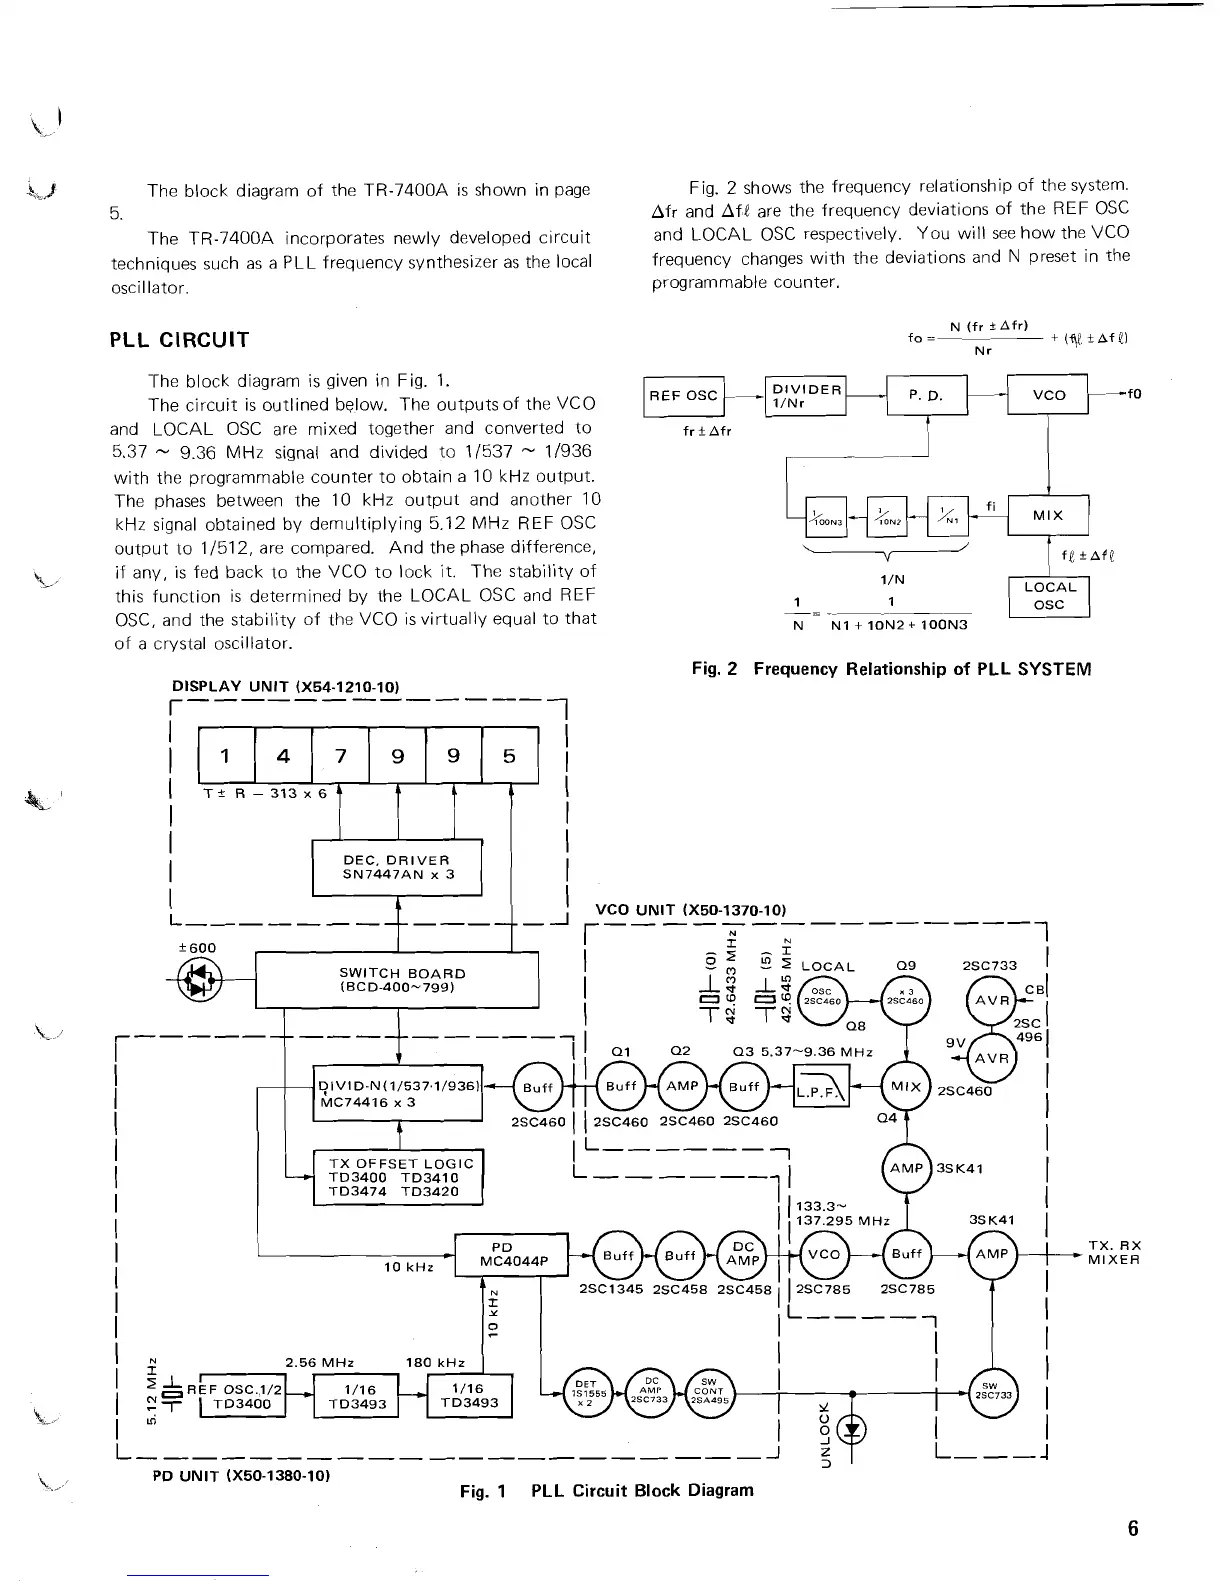
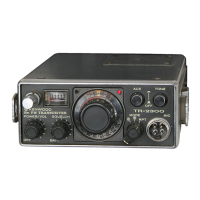
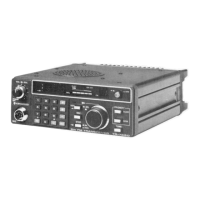
The block diagram of the TR-7400A is shown in page
Fig.
2
shows the frequency relationship of the system.
5.
Afr and
Af,! are the frequency deviations of the REF OSC
The TR-7400A incorporates new1 y developed circuit
and LOCAL
OSC respectively. You will see how the VCO
techniques such as a PLL frequency synthesizer as the local
frequency changes with the deviations and
N
preset in the
oscillator. programmable counter.
PLL
CIRCUIT
The block diagram is given in Fig. 1.
The circuit is outlined below. The outputs of the VCO
and LOCAL OSC are mixed together and converted to
5.37
--
9.36 MHz signal and divided to 1/537
--
If936
with the programmable counter to obtain a 10 kHz output.
The phases between the
10 kHz output and another 10
kHz signal obtained by demultiplying 5.12 MHz REF OSC
output to
11512, are compared. And the phase difference,
if any, is fed back to the VCO to lock it. The stability of
this function is determined by the LOCAL OSC and REF
OSC, and the stability of the
VCO is virtually equal to that
of a crystal oscillator.
REF
OSC
El
N (fr +Afr)
fo
=-----
+
(41
+Of
9.)
Nr
-
DIVIDER
1/Nr
P.
D.
I
LOCAL
Fig.
2
Frequency Relationship of PLL
SYSTEM
DISPLAY
UNlT
(X54-1210-10)
r------------
1
UNlT
(X50-1370-10)
-
I
I
----
2.56
MHz
PD
UNlT
(X50-1380-10)
Fig.
1
PLL Circuit Block Diagram
TX. RX
*MIXER