Chapter 5: Data Logging 12
© 2003 Klein Instruments Corporation
In the example above, the Model is "DM 559 - 6500". The last 4 characters of the model are what we
call a "file extension" or a "Spec Selection", and this is used to select one of possibly several specs for
the same model. In this case, there is only one Spec Selection, here "6500".
To take a reading, point the colorimeter at the area to be measured, and press one of the measure
buttons. The number on the button should change to "ok" or "np" meaning OK or NoPass for that
reading. When all Measure Buttons for the Spec have been pressed, the window next to the Spec
Selection will show "OK" or "NoPass" and the "Record to DataBase" button is enabled.
You may press the "Record to DataBase" button, and the measurements and current specs will be
written to a record in the database. You may press "Show Data" and the details of all records will show
at the bottom of the window. Scroll down to the last entry to see the data you have recorded.
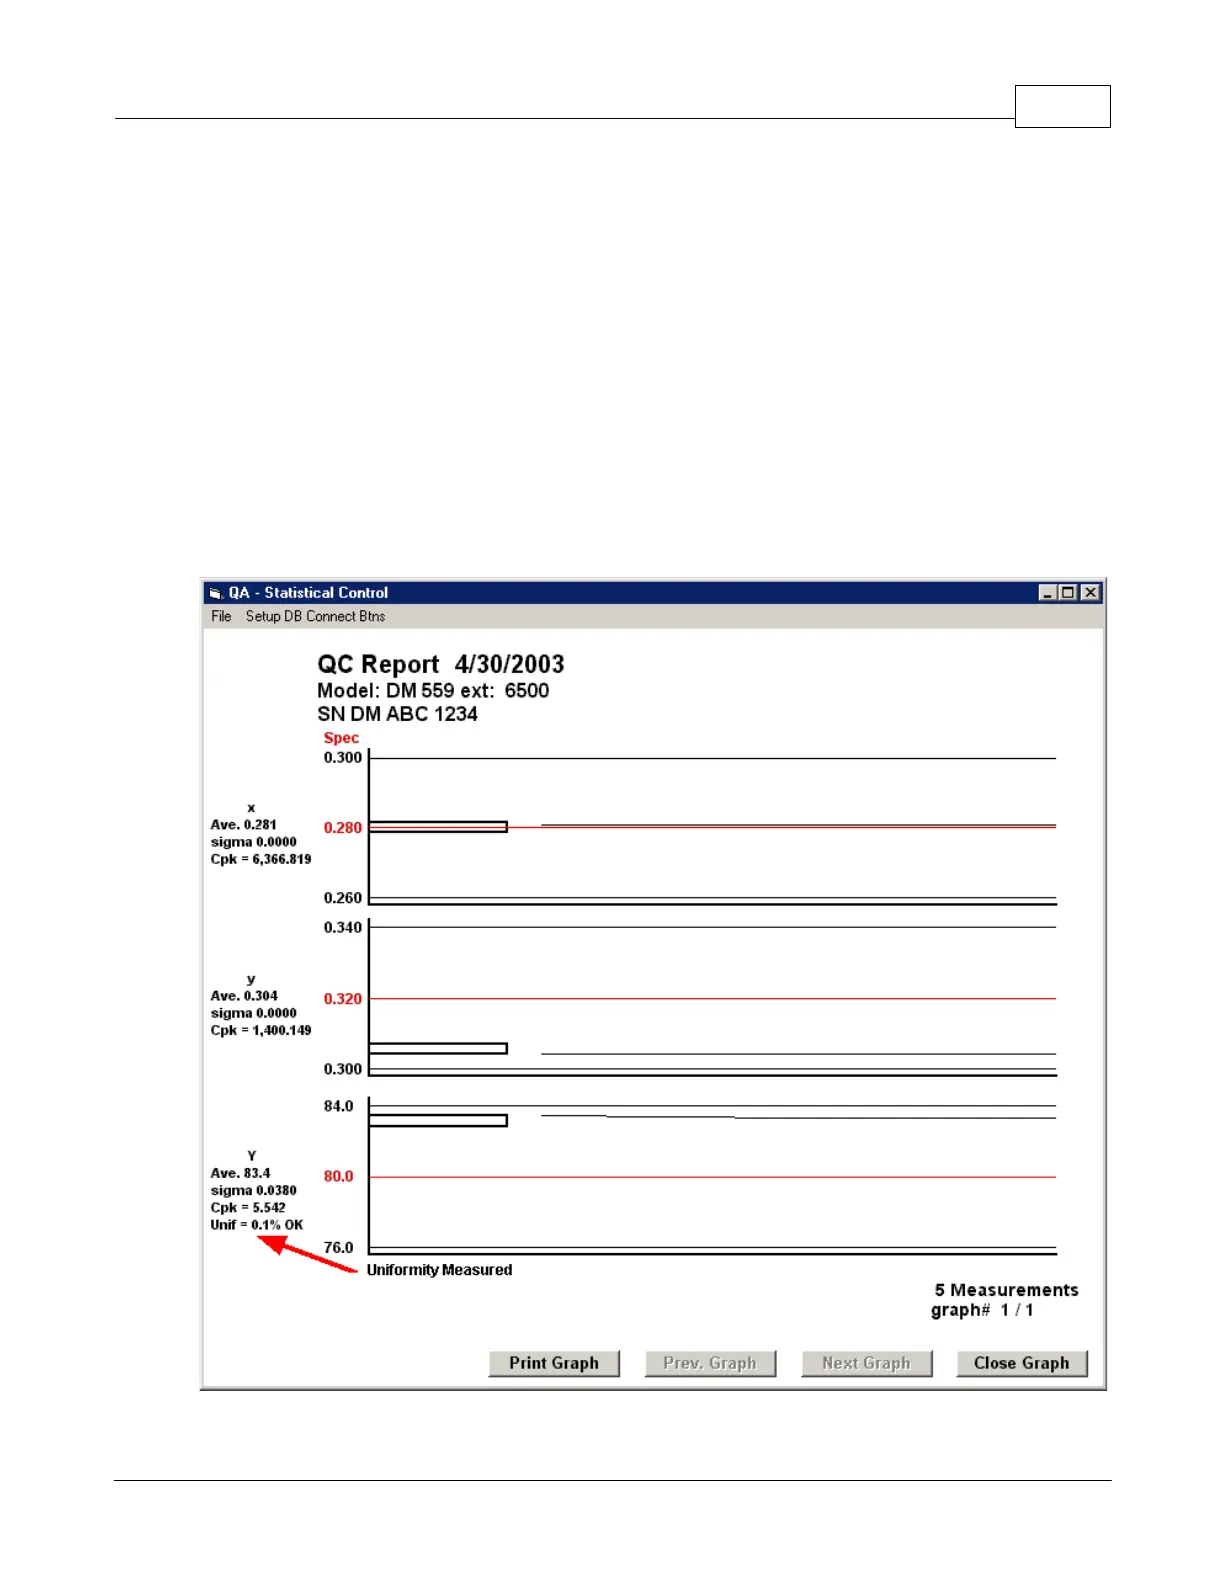
The "Show Report" button will show a graph of the data you have just taken, including an OK / NoPass
indicatior for the uniformity of the Y reading, (depending on the value set in the Data Logging Setup). You
may save the record to an Excel file from the graph window (shown below).
The graph may be printed and used as a Report.
 Loading...