L-ACOUSTICS XT Manual V1.1 2/11/2003 27
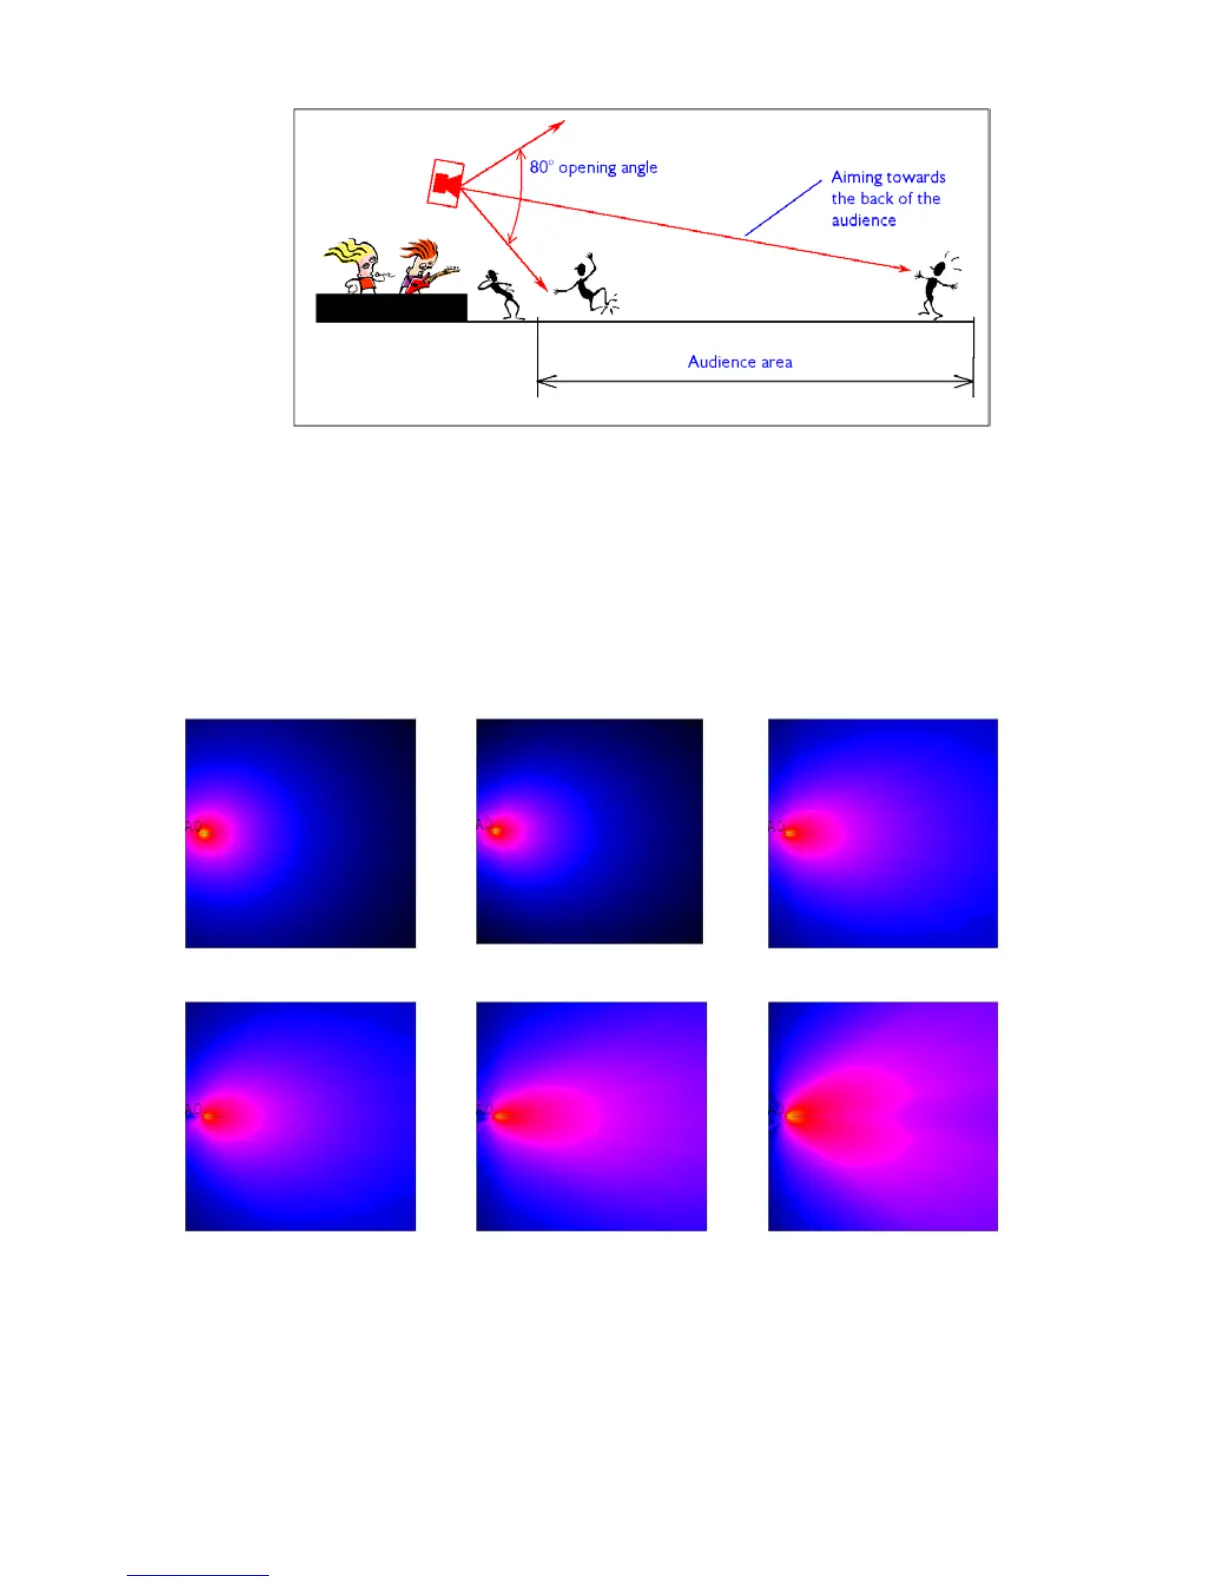
Figure 10: General guidelines for aiming XT enclosures
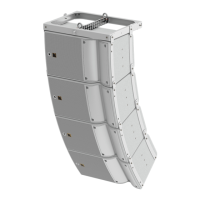
4.3 ARRAYING XT ENCLOSURES
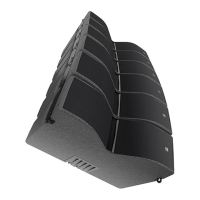
Figure 11 shows SPL mappings at octave band frequencies for a single XT enclosure (generated using
CATT-Acoustic modeling software), demonstrating the evenness of coverage and single point source
behavior that is obtained using coaxial technology.
Note: for color versions of figures 11, 12, 13 and 15 please see the XT manual PDF file that is available for
download from www.l-acoustics.com
125 Hz
250 Hz
500 Hz
1 kHz
2 kHz
4 kHz
Figure 11: SPL mappings at octave band frequencies for a single XT enclosure
Figure 12 shows SPL mappings at octave band frequencies for two XT enclosures with a spacing of 0.5
meters. Uneven coverage above 500 Hz demonstrates the comb filtering interference effects that
arise due to path length differences as a function of listener position.